- Home >
- Stock Photos >
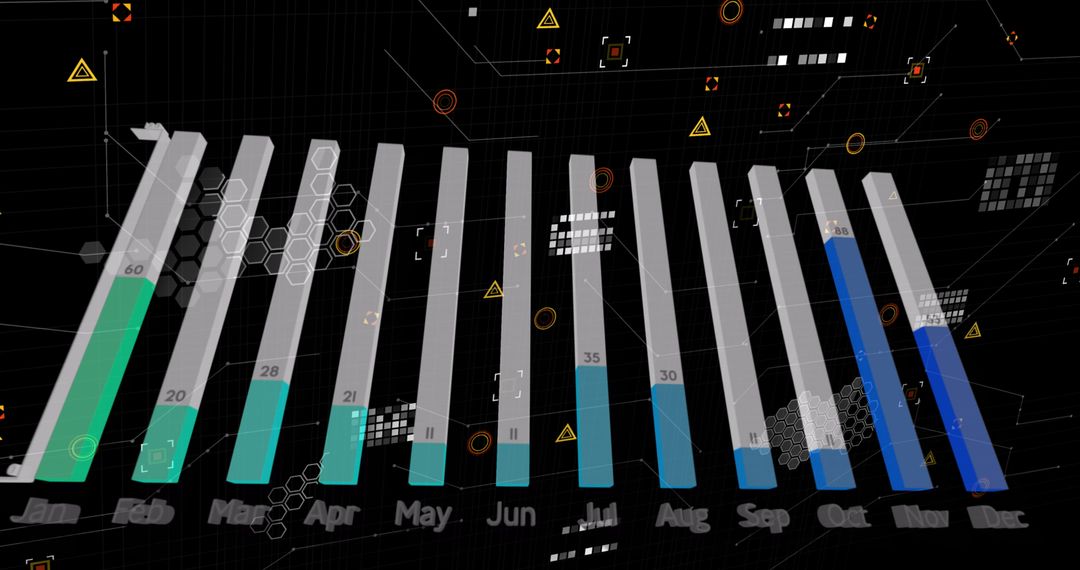
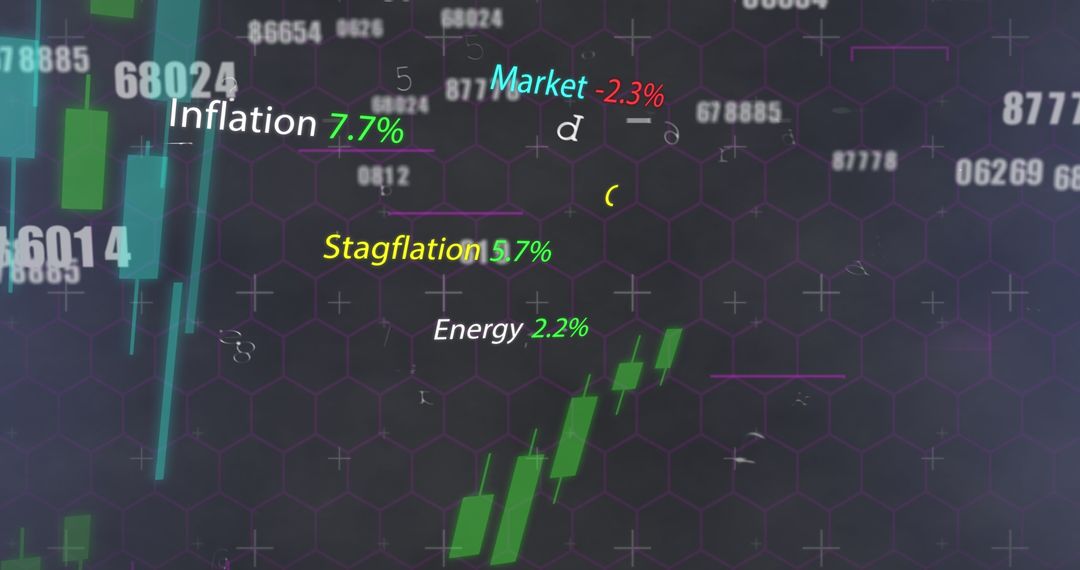
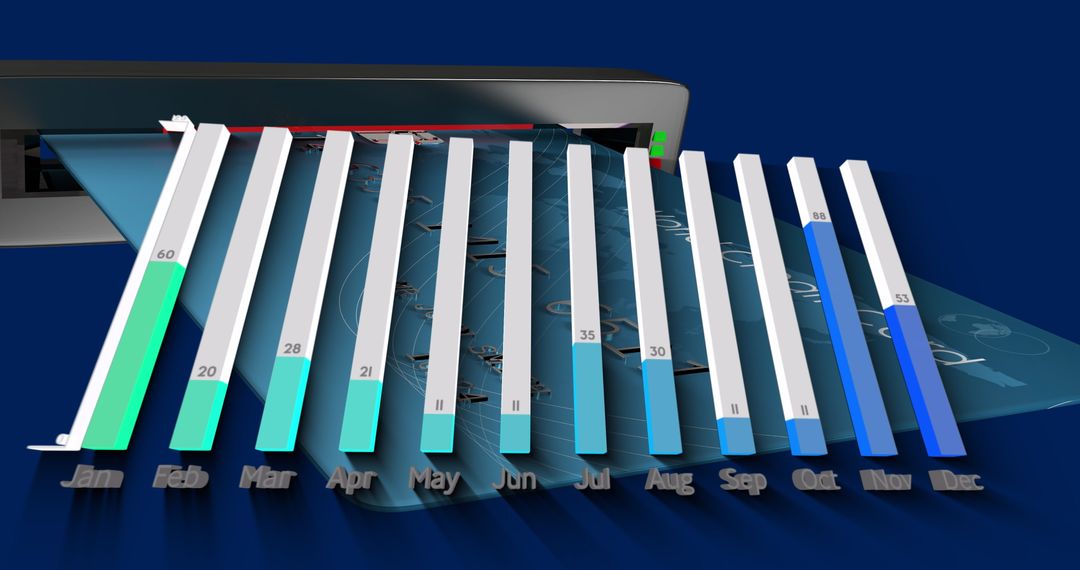
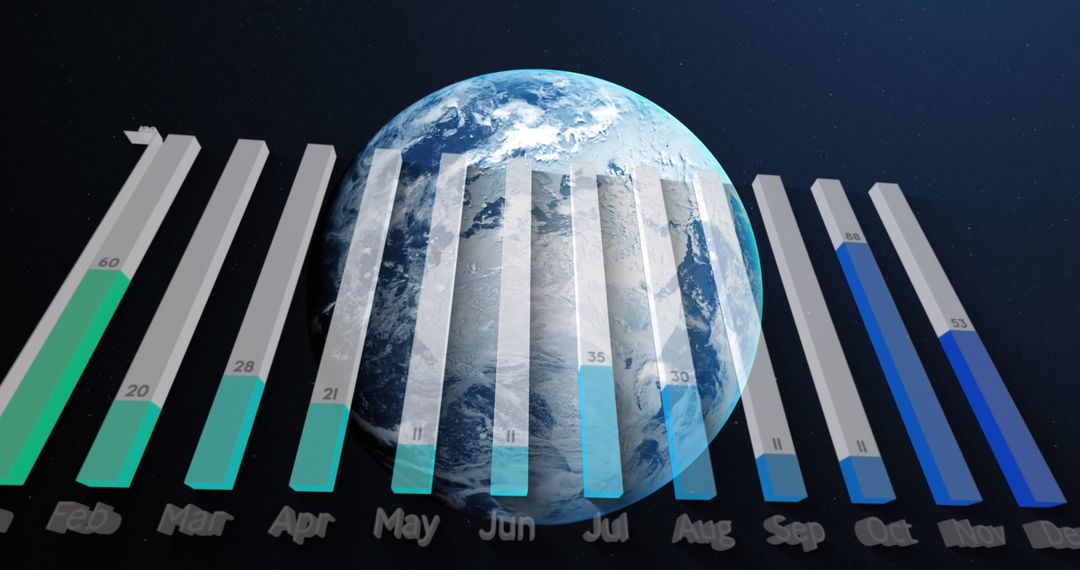
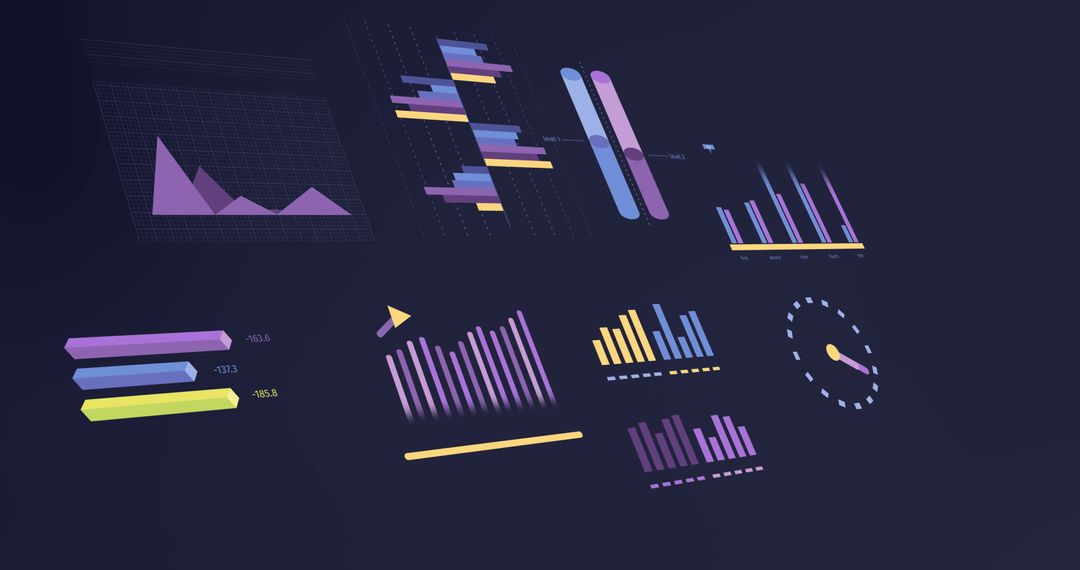
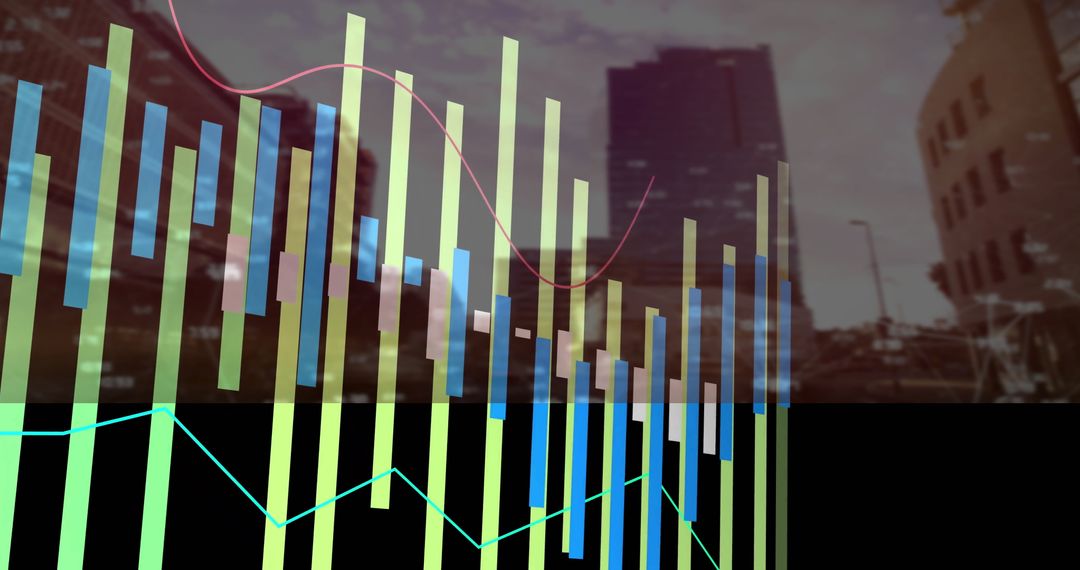
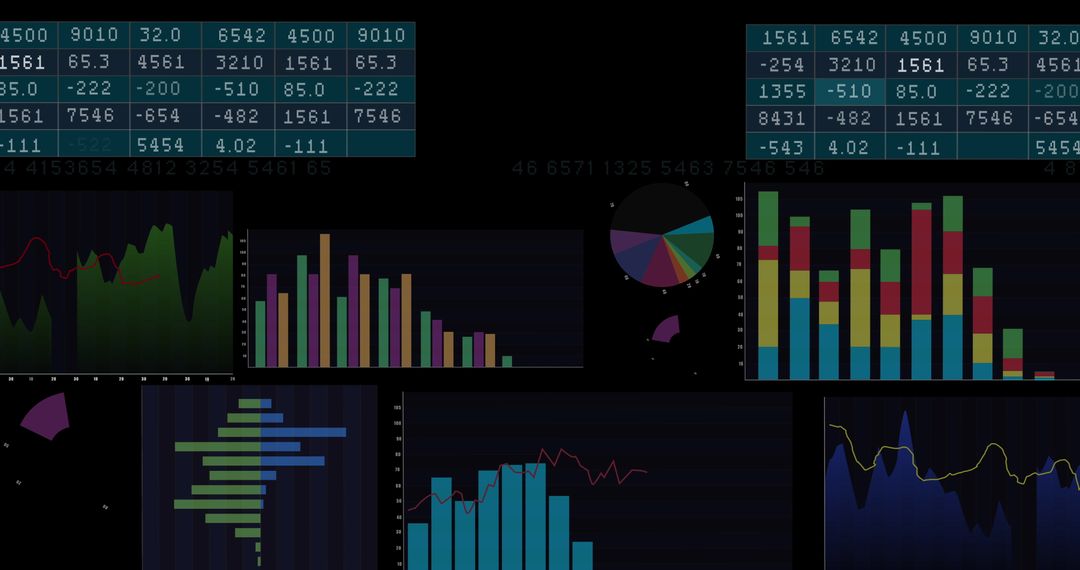
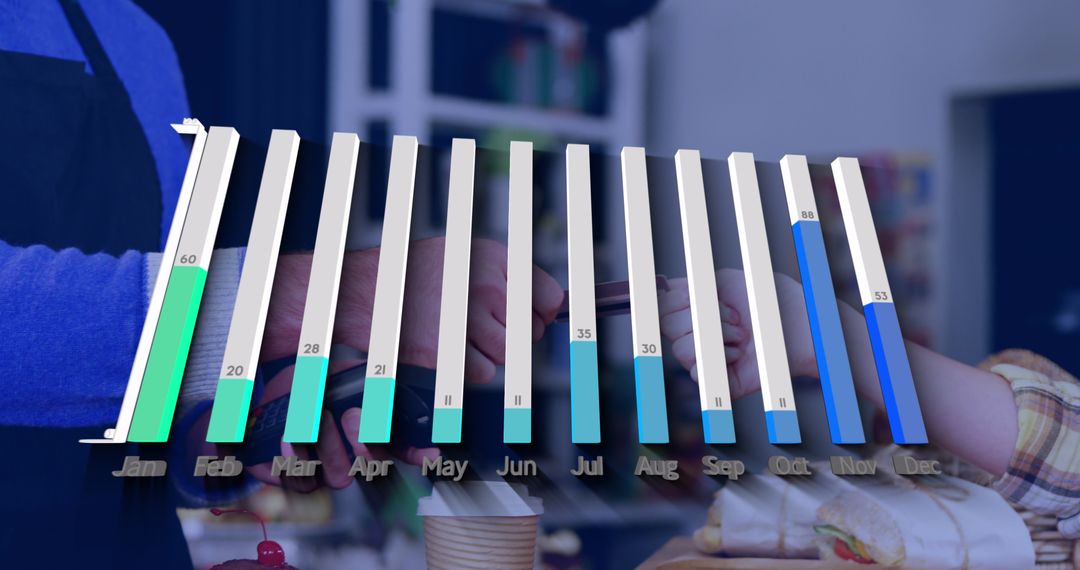
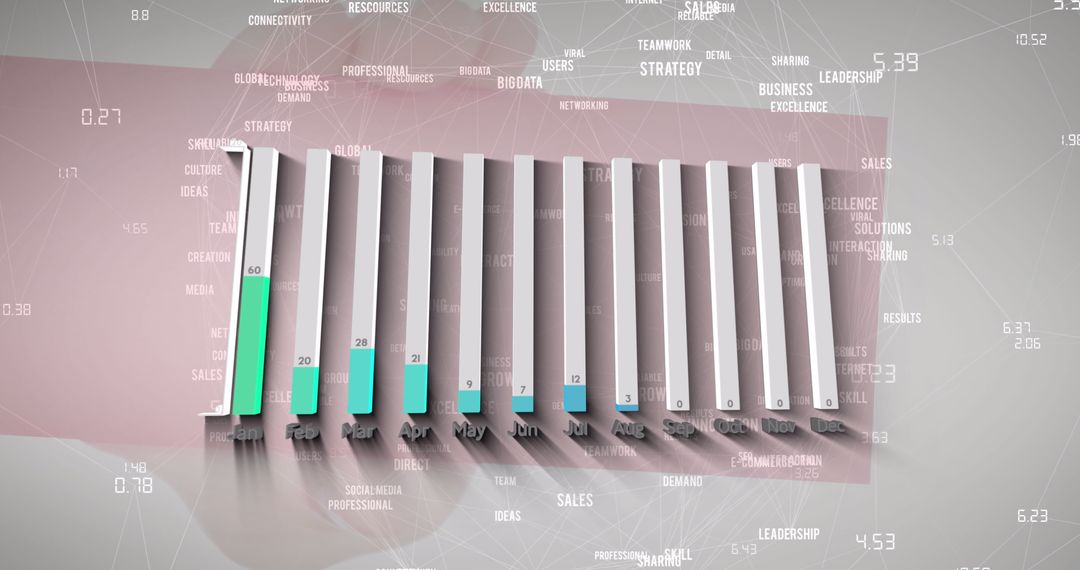
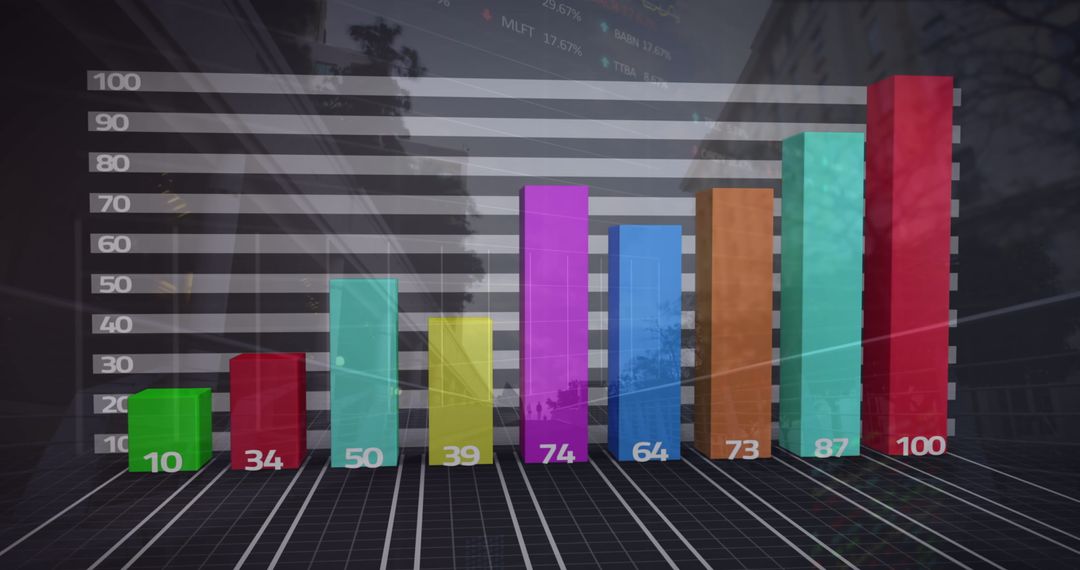
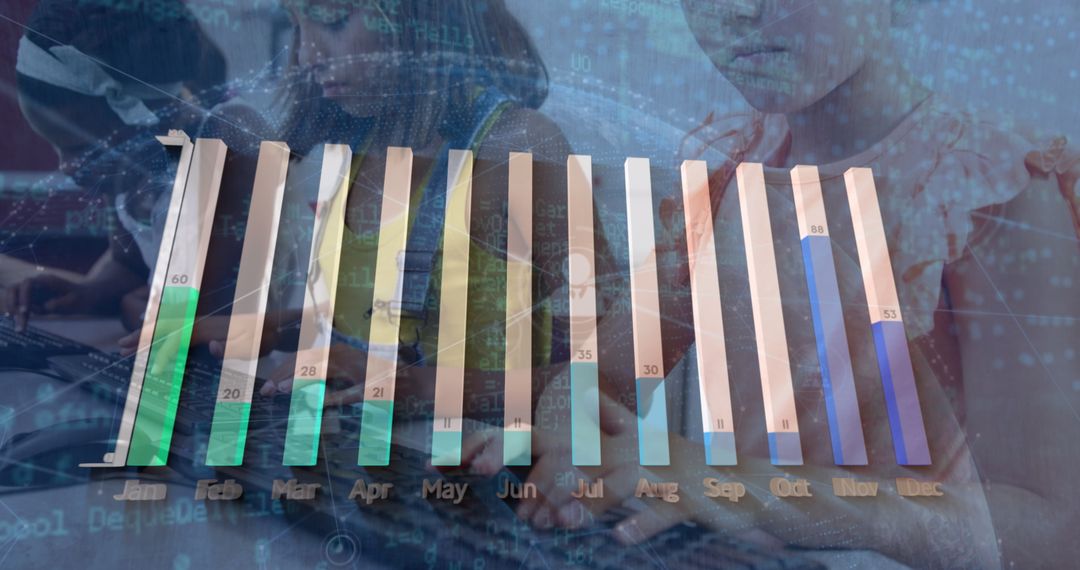
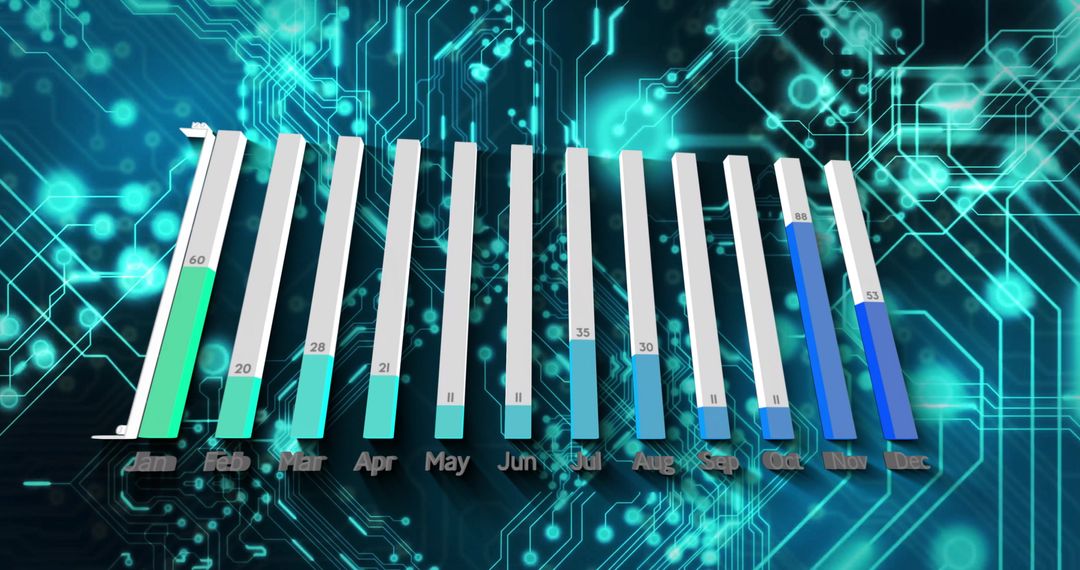
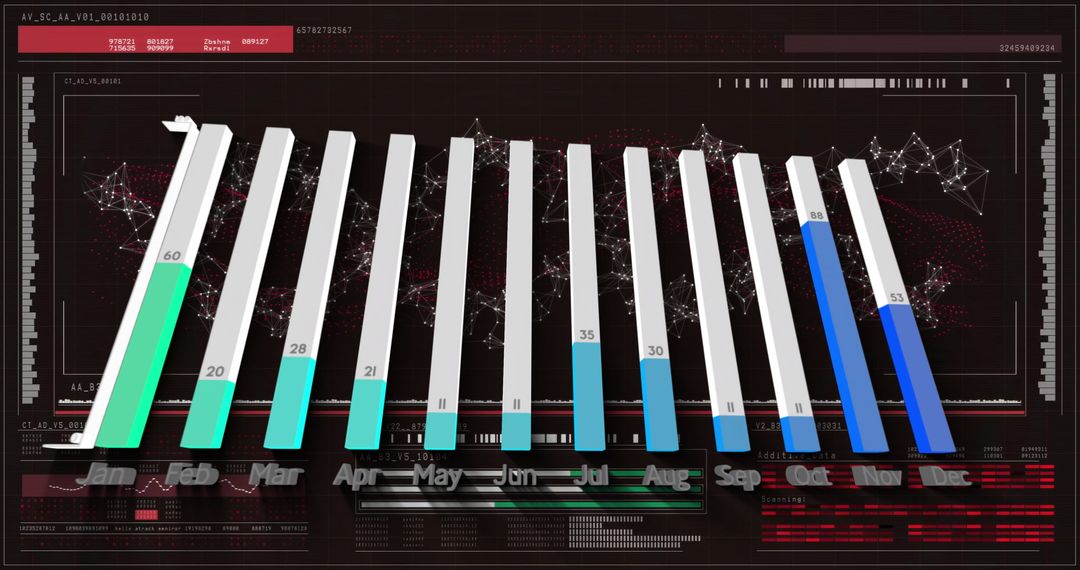
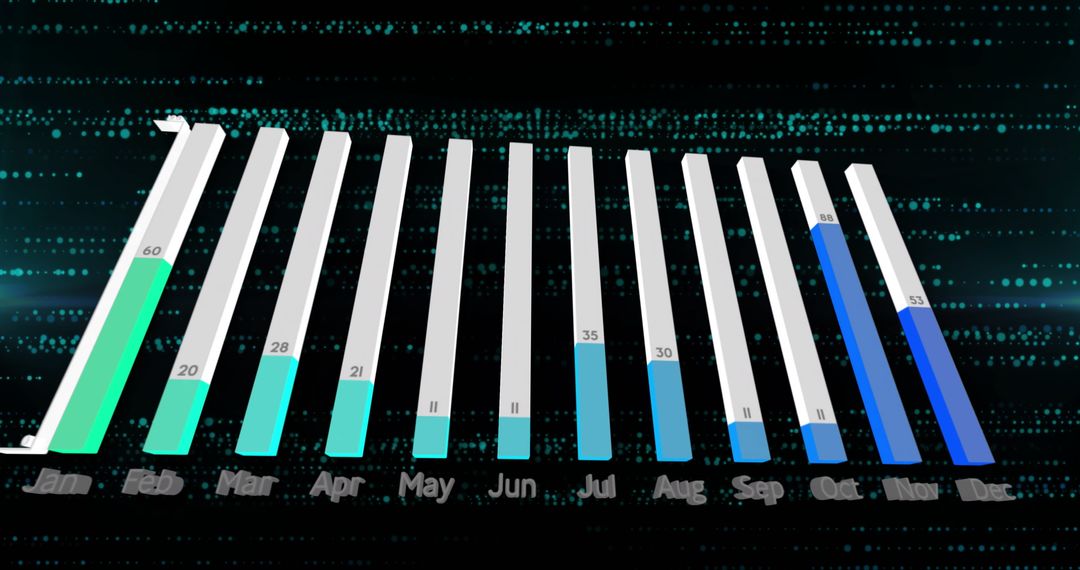
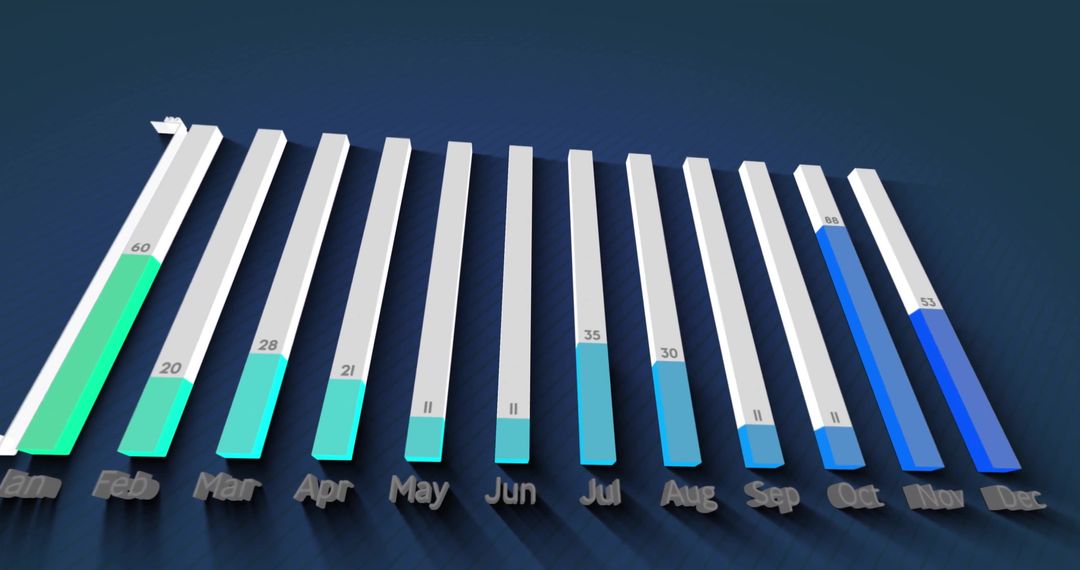
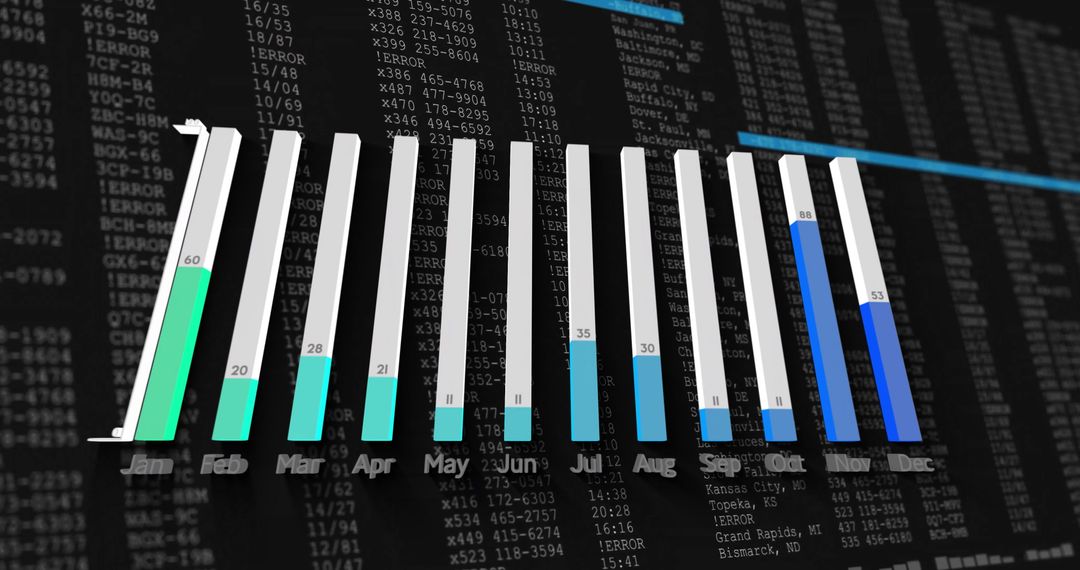
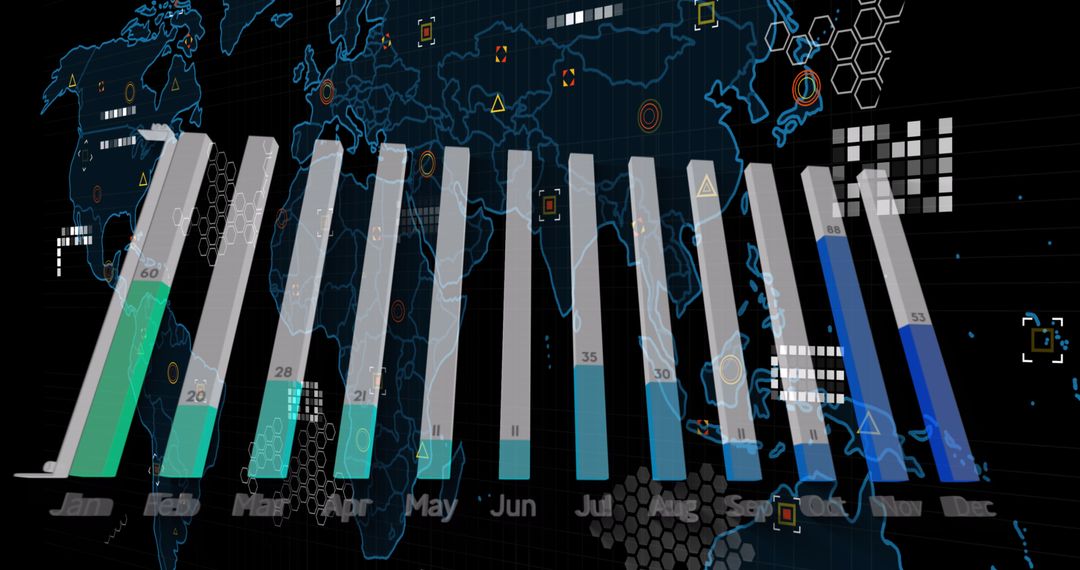
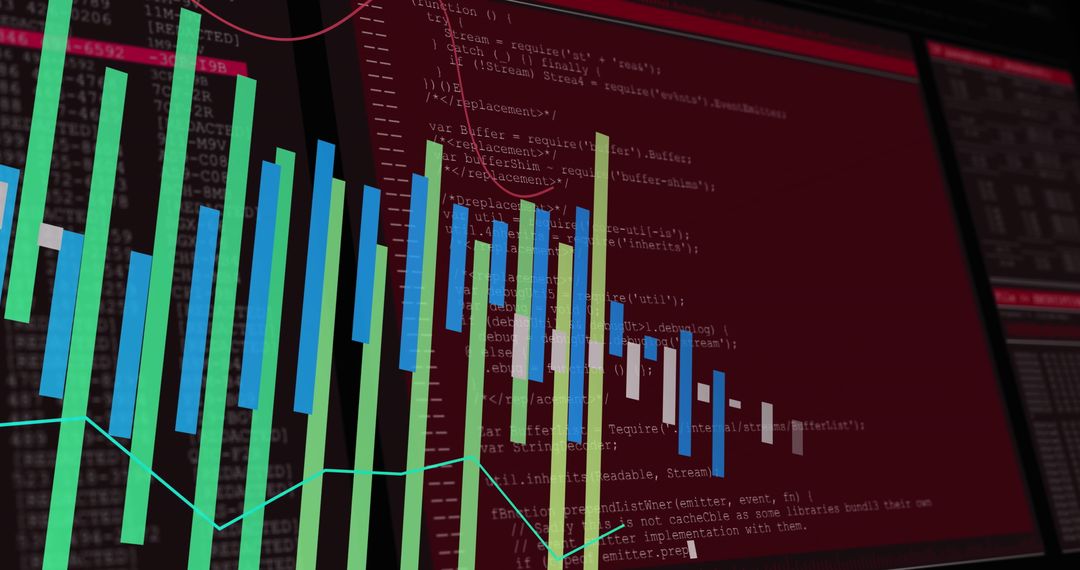
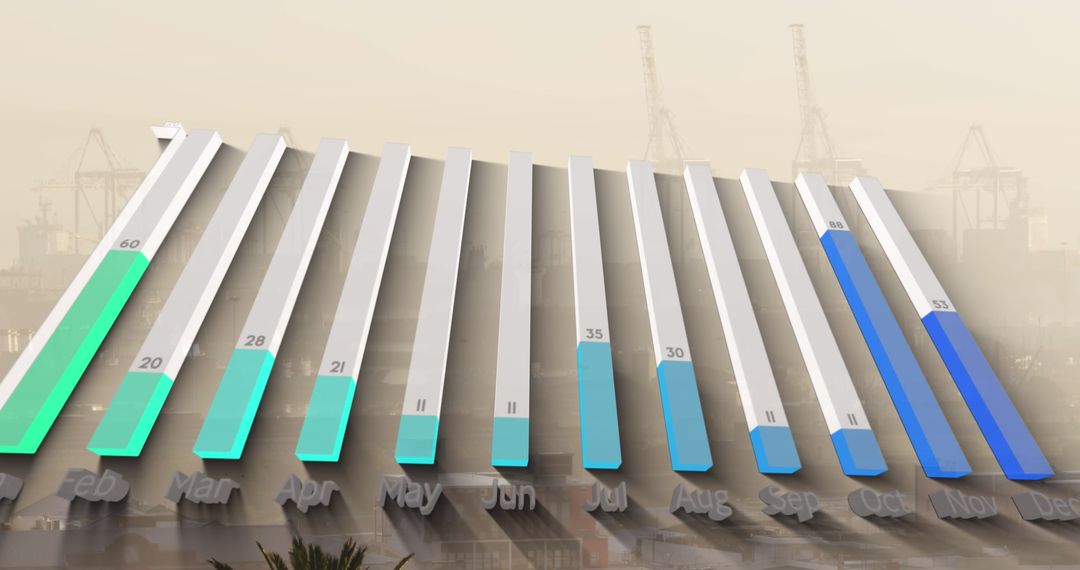
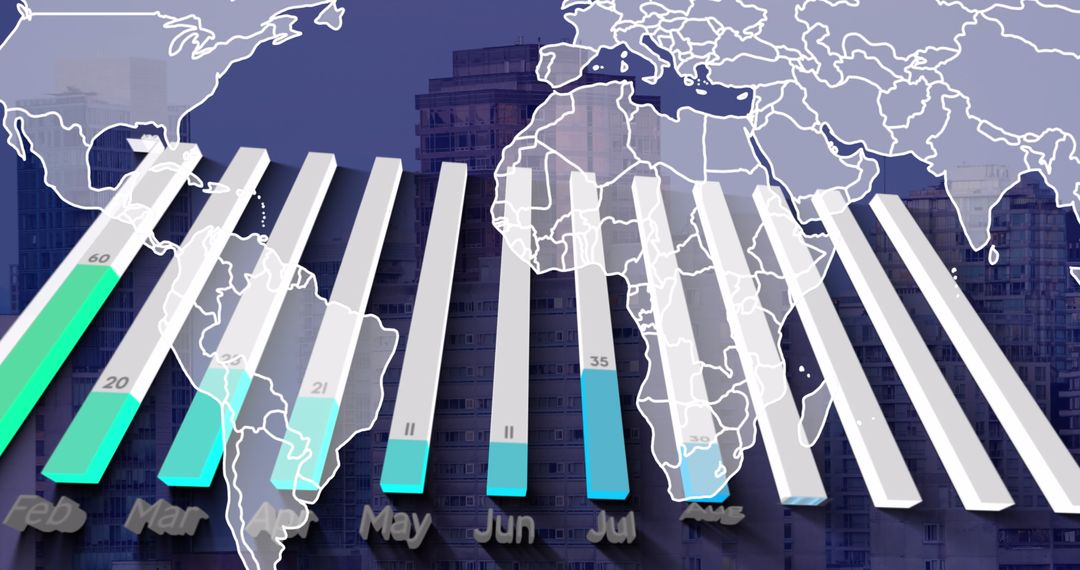
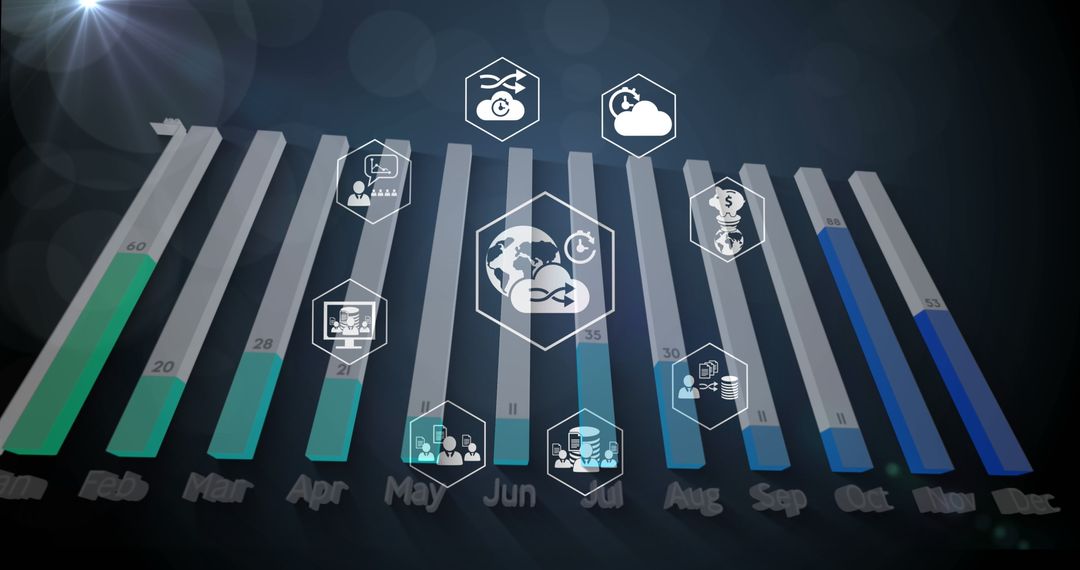
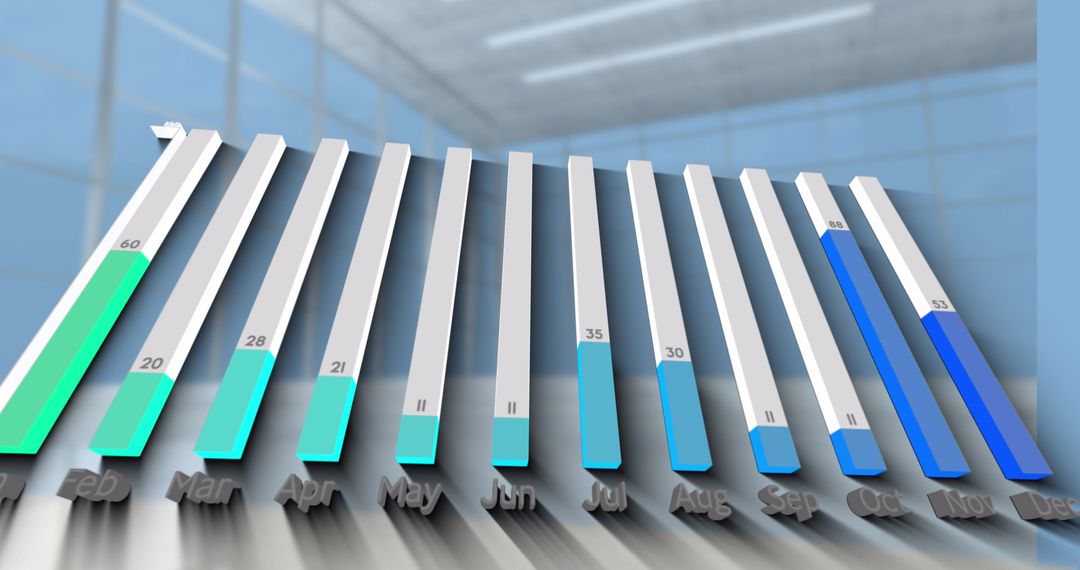
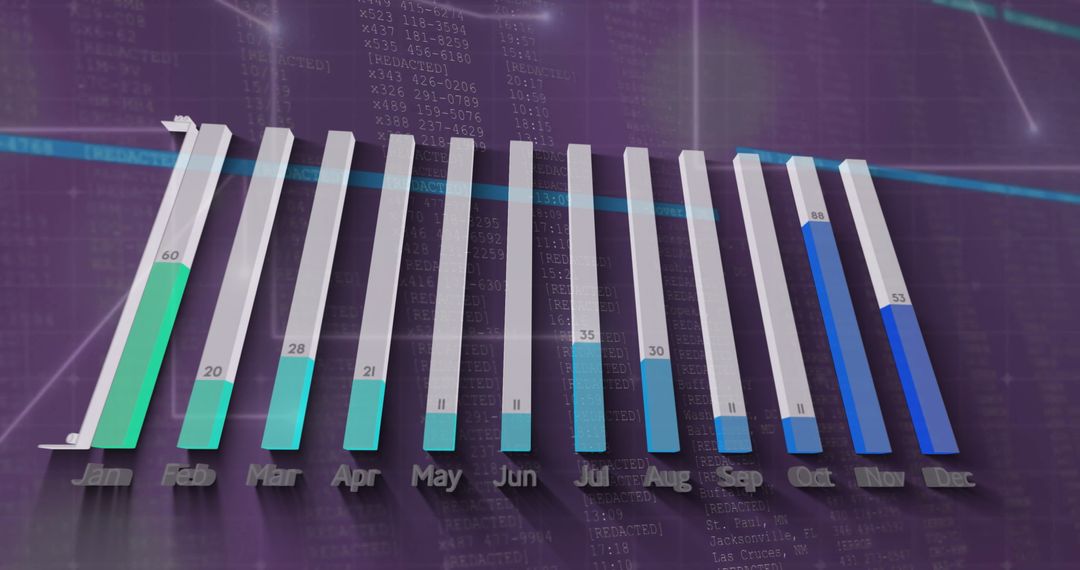
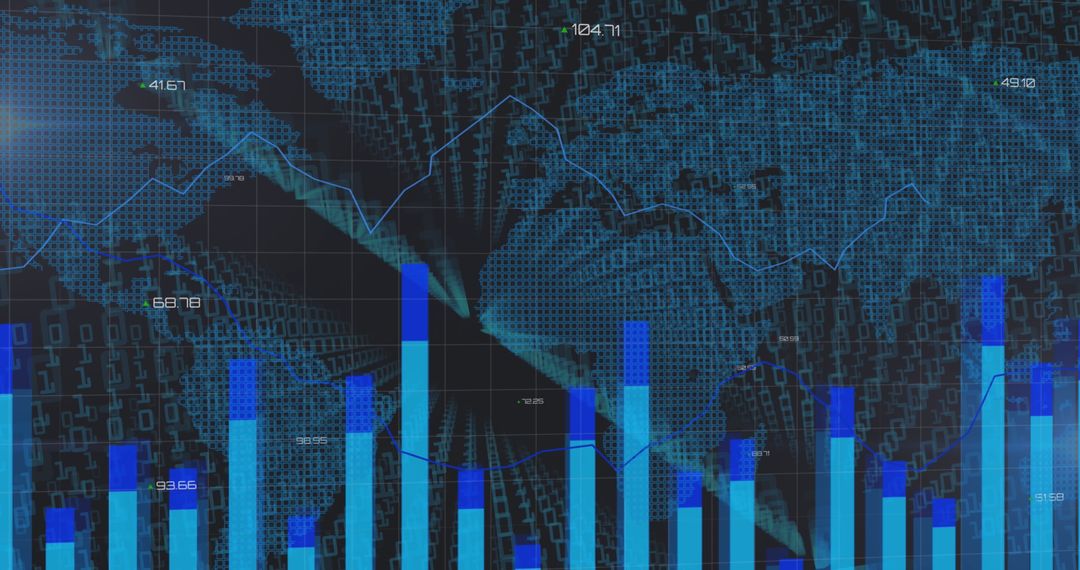
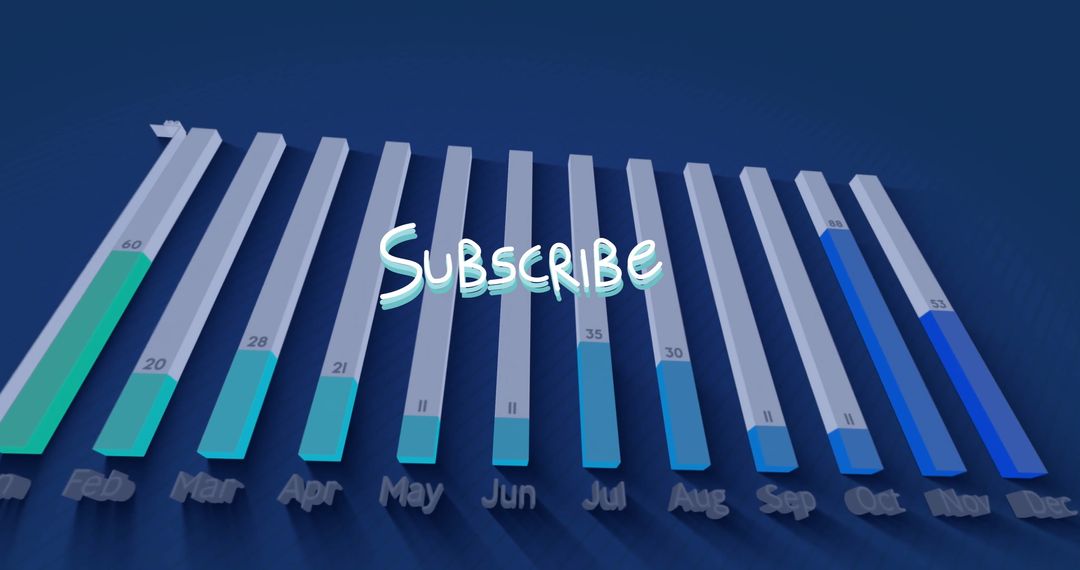
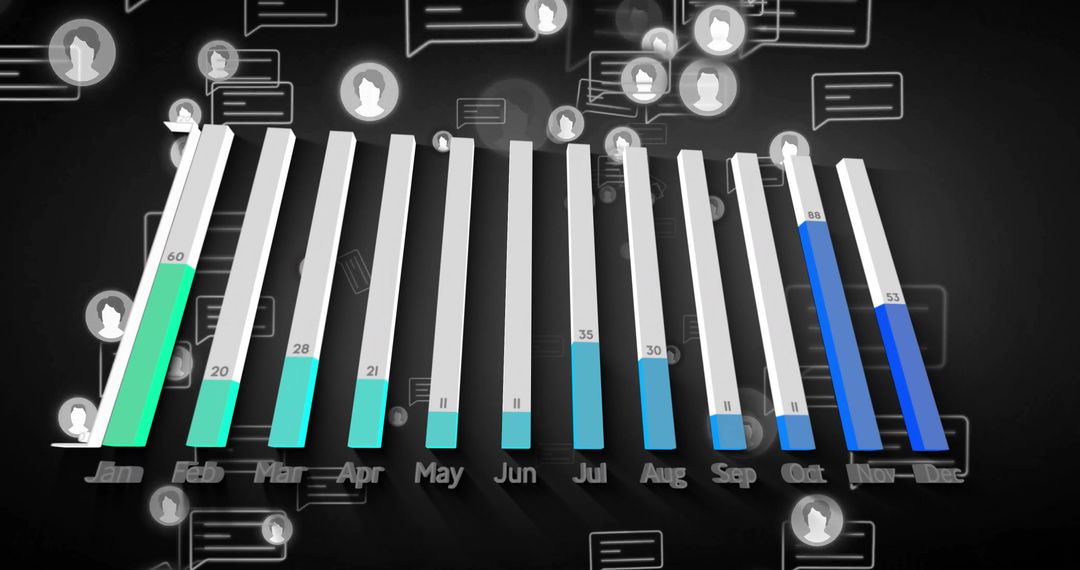
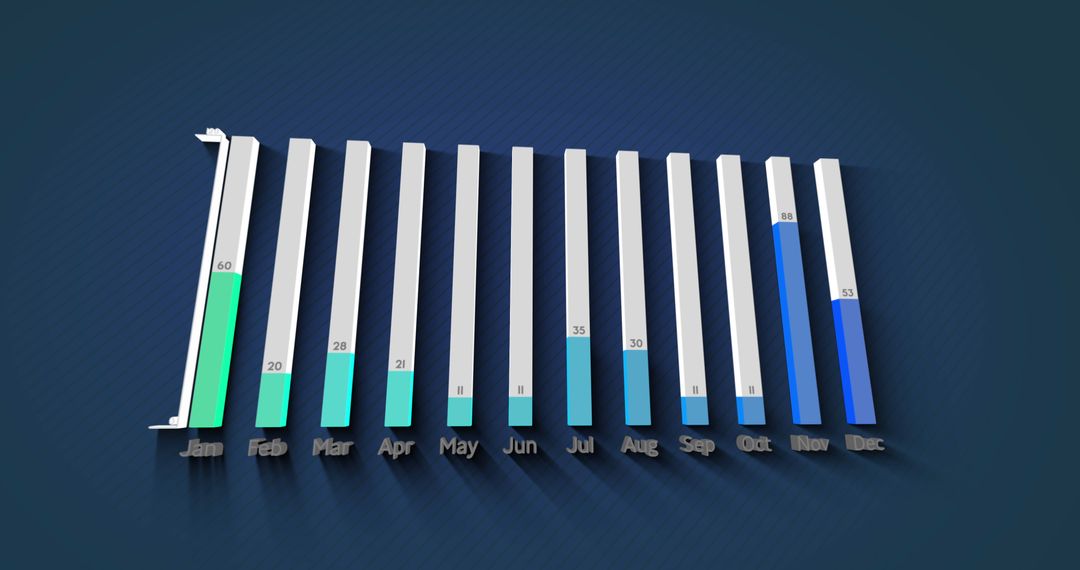
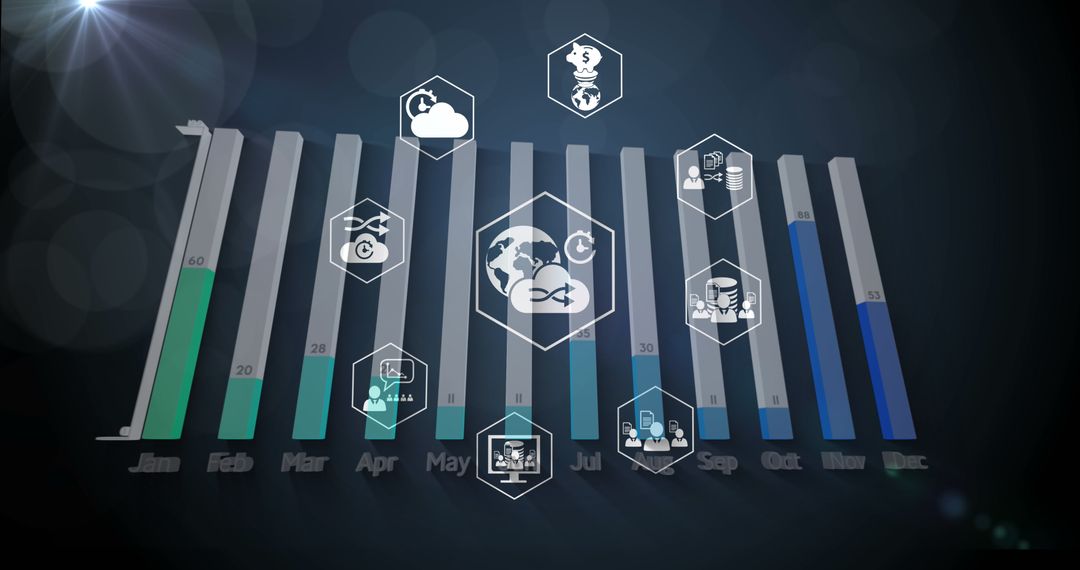
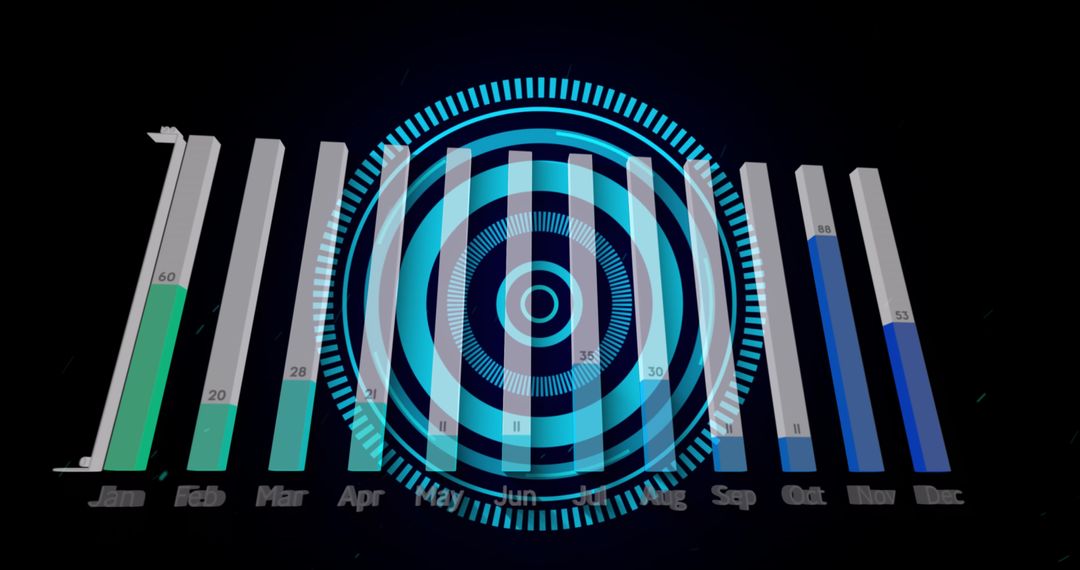
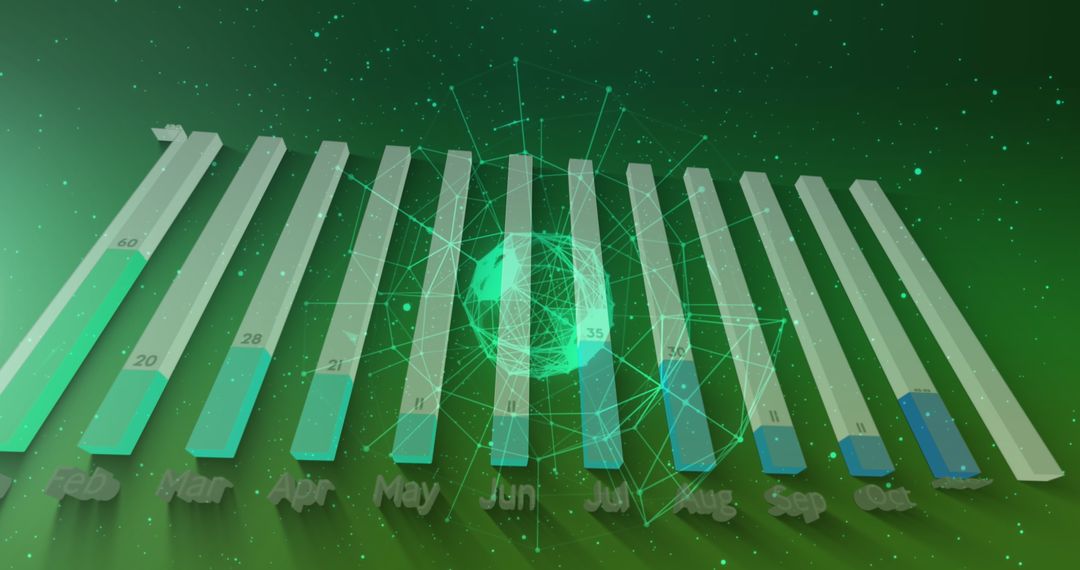
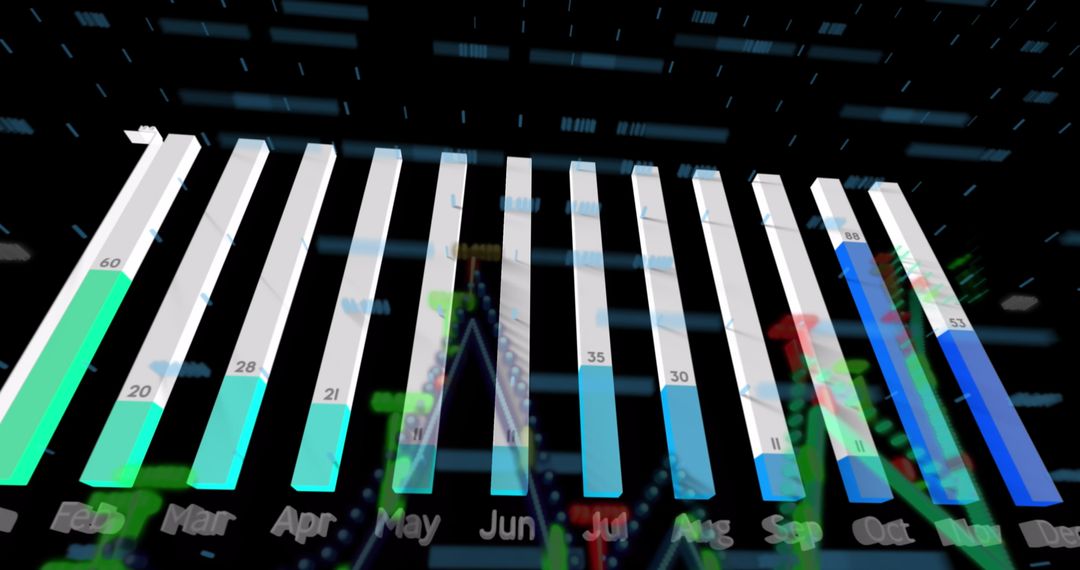
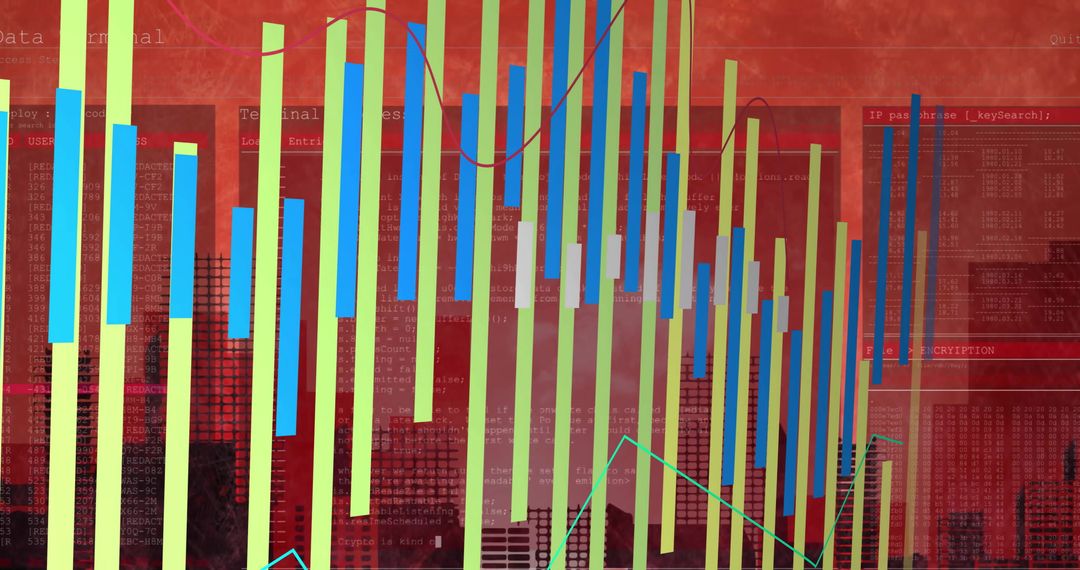
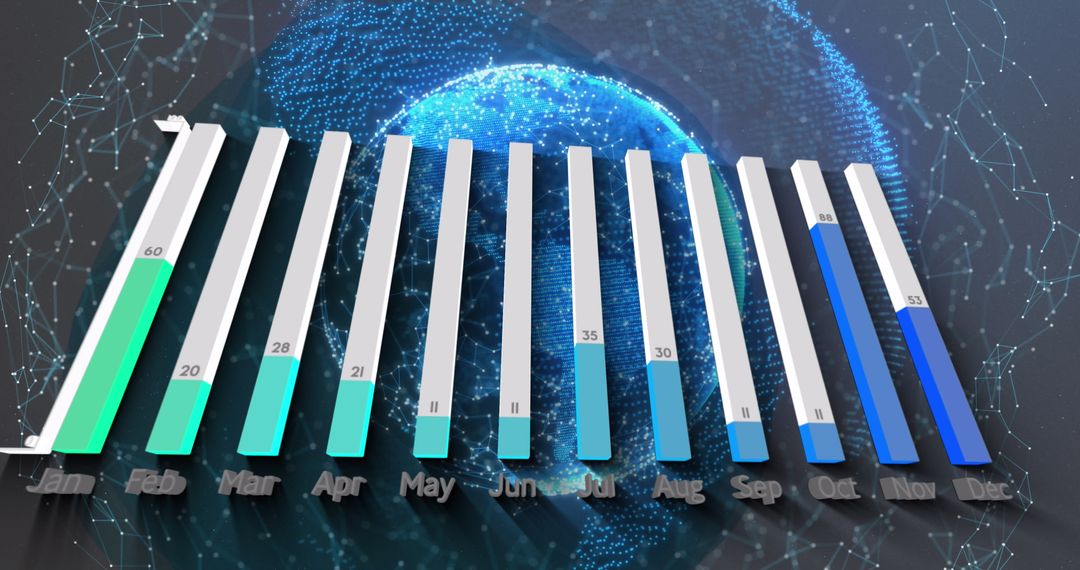
- Modern Bar Graph Visualization with Monthly Data on Dark Background
Modern Bar Graph Visualization with Monthly Data on Dark Background Image

A vibrant and dynamic bar graph displaying monthly performance data against a dark geometric background. Useful for illustrating trends in business reports, educational material on data analysis, or visual aids in presentations focused on financial performance. The colorful shades emphasize differences across months, adding to its visual appeal.
Powered by  - Get 15% off with code: PIKWIZARD15


2
downloads
downloads
Tags:
More
Credit Photo
If you would like to credit the Photo, here are some ways you can do so
Text Link
photo Link
<span class="text-link">
<span>
<a target="_blank" href=https://pikwizard.com/photo/modern-bar-graph-visualization-with-monthly-data-on-dark-background/40c39dc4575e4ca8dc854223ad3673df/>PikWizard</a>
</span>
</span>
<span class="image-link">
<span
style="margin: 0 0 20px 0; display: inline-block; vertical-align: middle; width: 100%;"
>
<a
target="_blank"
href="https://pikwizard.com/photo/modern-bar-graph-visualization-with-monthly-data-on-dark-background/40c39dc4575e4ca8dc854223ad3673df/"
style="text-decoration: none; font-size: 10px; margin: 0;"
>
<img src="https://pikwizard.com/pw/medium/40c39dc4575e4ca8dc854223ad3673df.jpg" style="margin: 0; width: 100%;" alt="" />
<p style="font-size: 12px; margin: 0;">PikWizard</p>
</a>
</span>
</span>
Free (free of charge)
Free for personal and commercial use.
Author: Authentic Images
Similar Free Stock Images

Premium

Premium


Premium

Premium


Premium

Premium


Premium

Premium

Premium


Premium


Premium


Premium


Premium


Premium


Premium

Premium


Premium
Premium


Premium


Premium


Premium


Premium

Premium

Premium