- Home >
- Stock Photos >
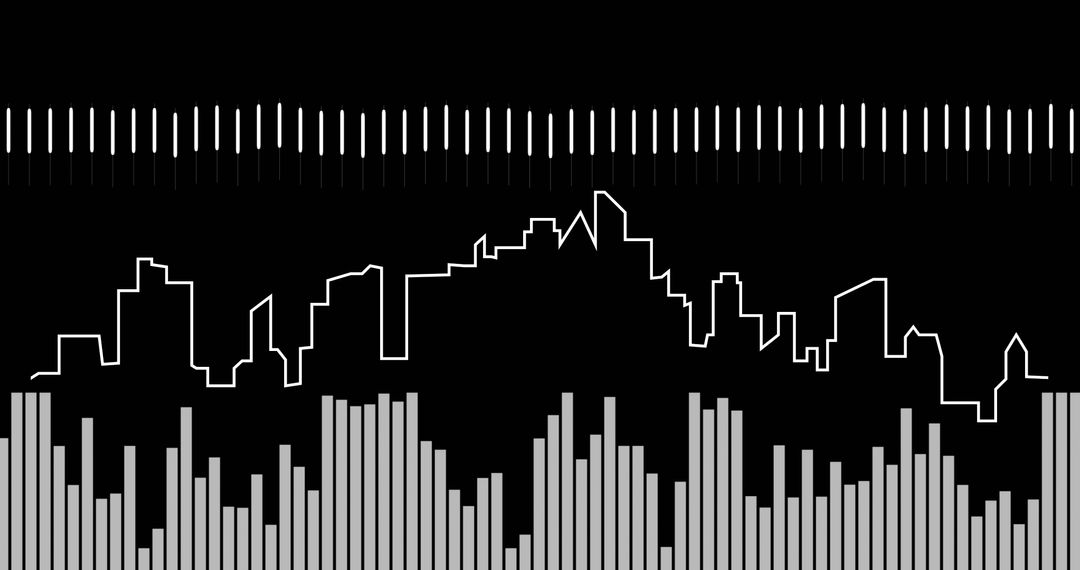
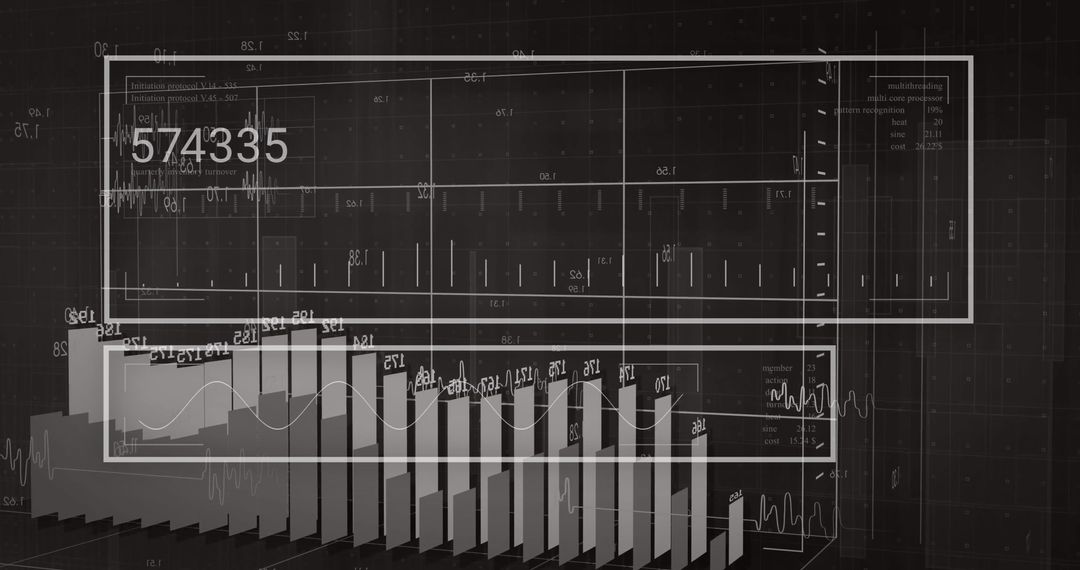
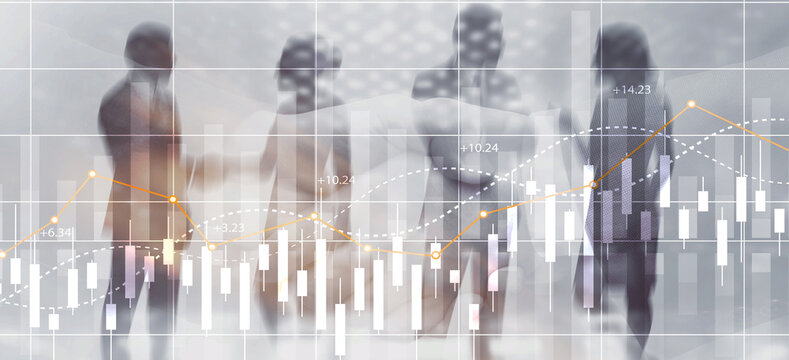
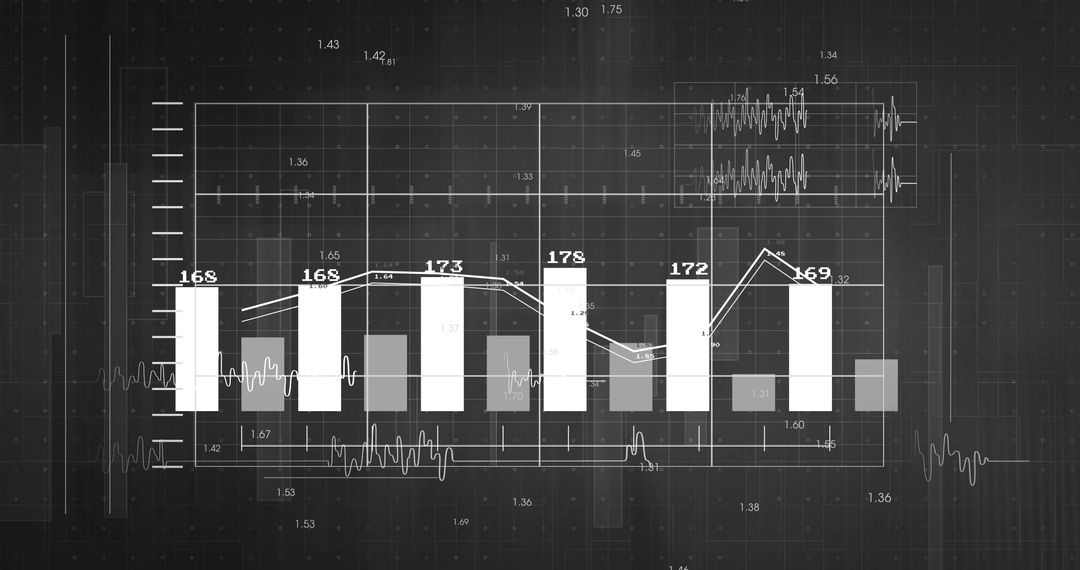
- Modern Financial Data Visualization with Charts and Graphs
Modern Financial Data Visualization with Charts and Graphs Image
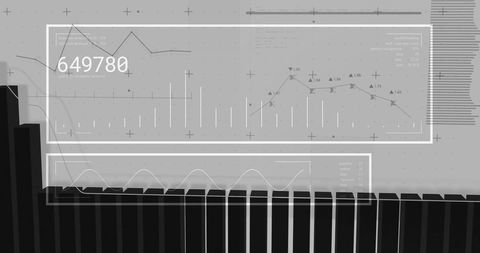
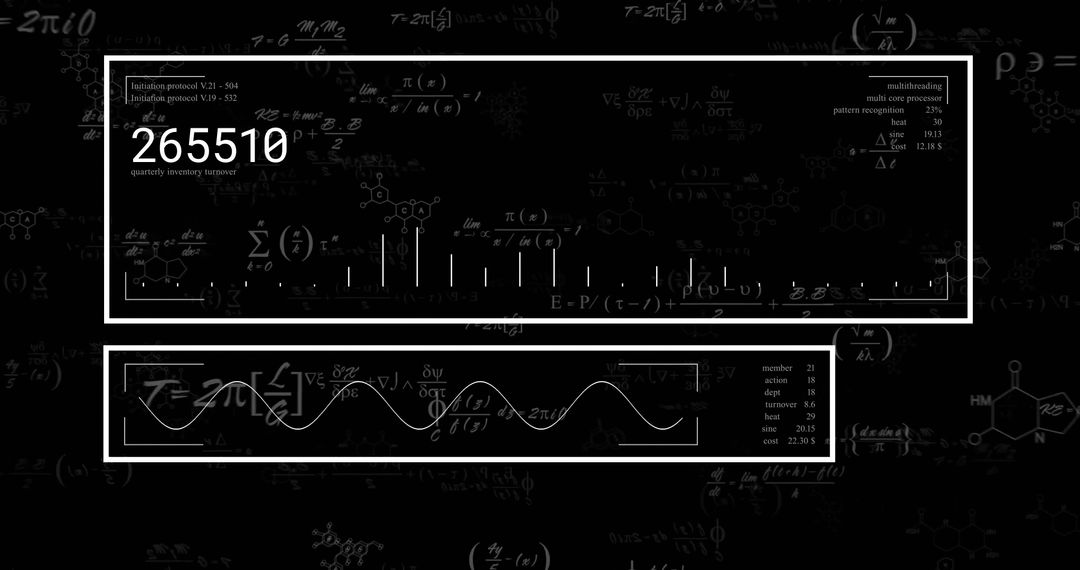
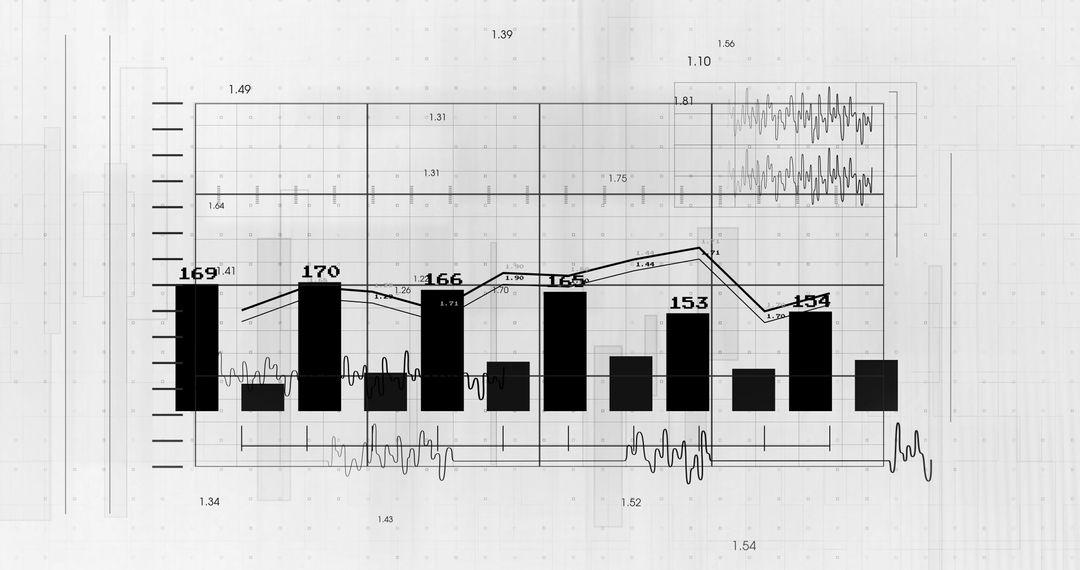
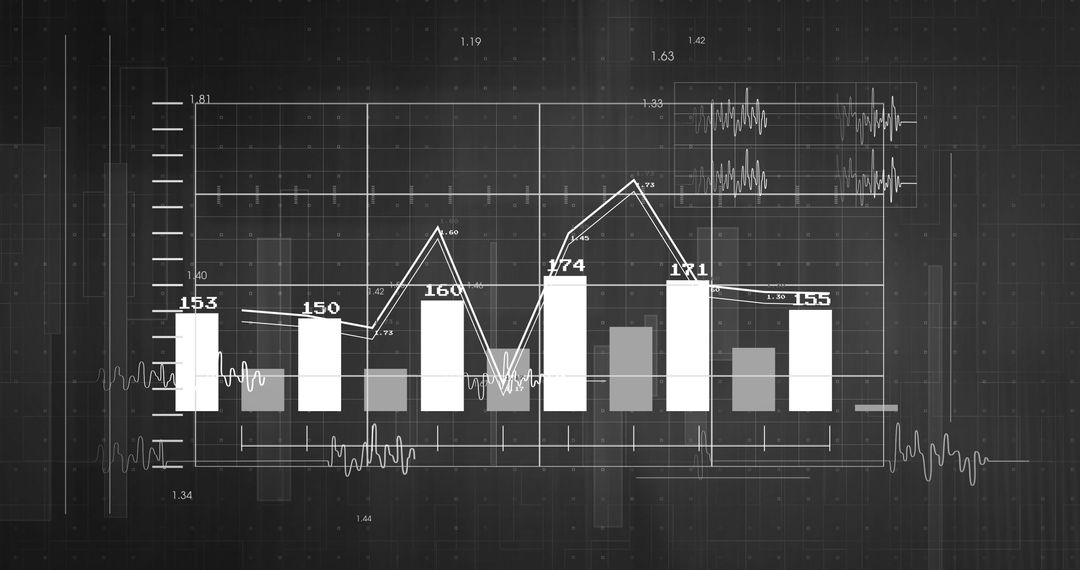
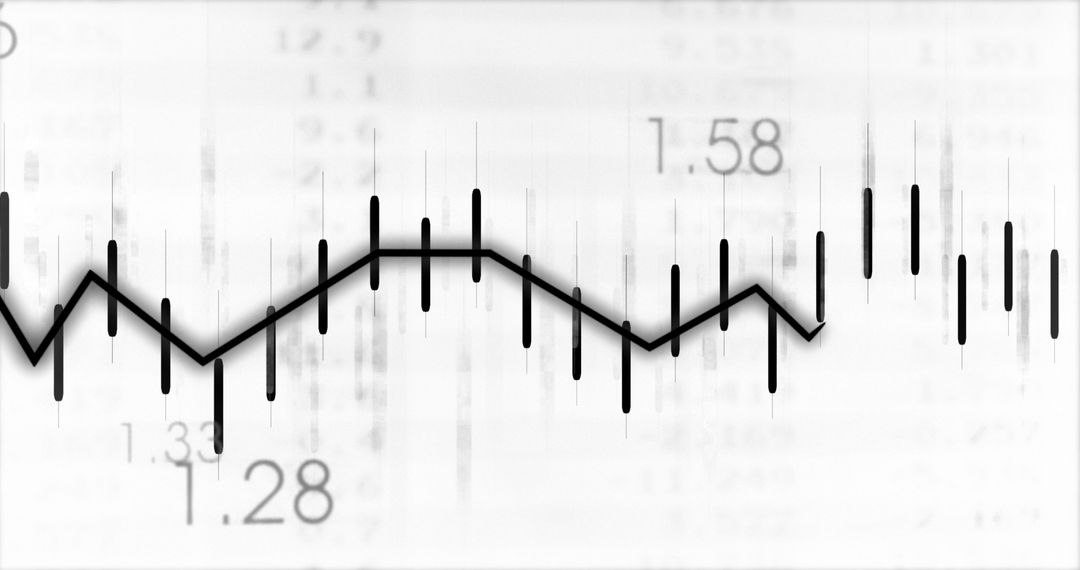
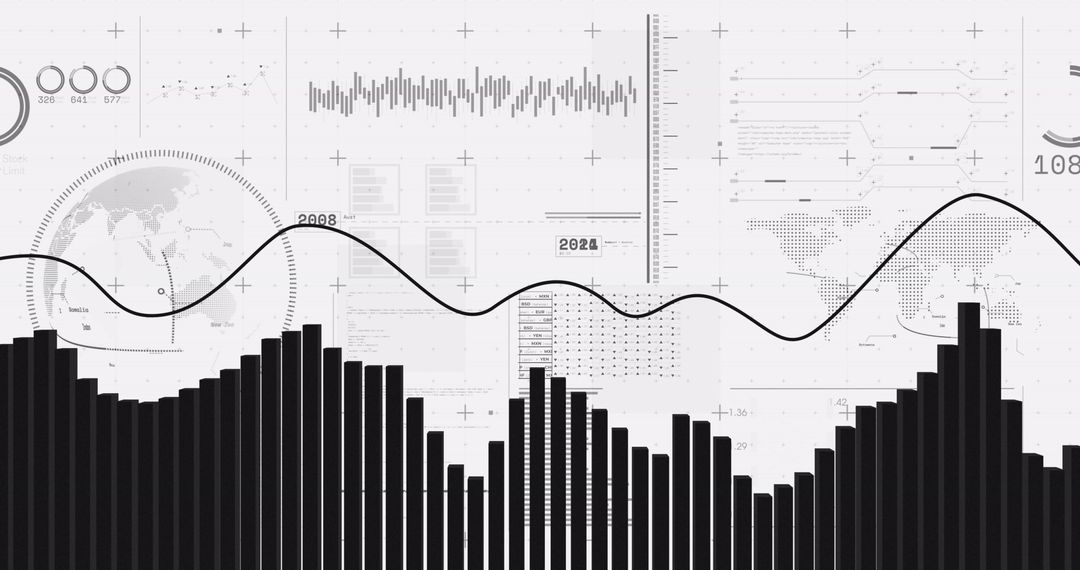
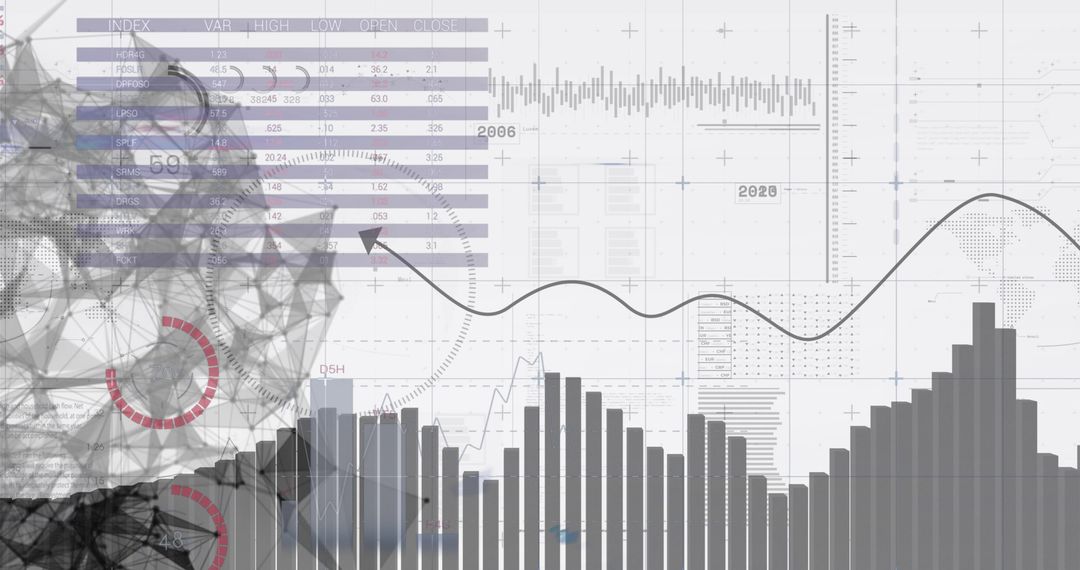
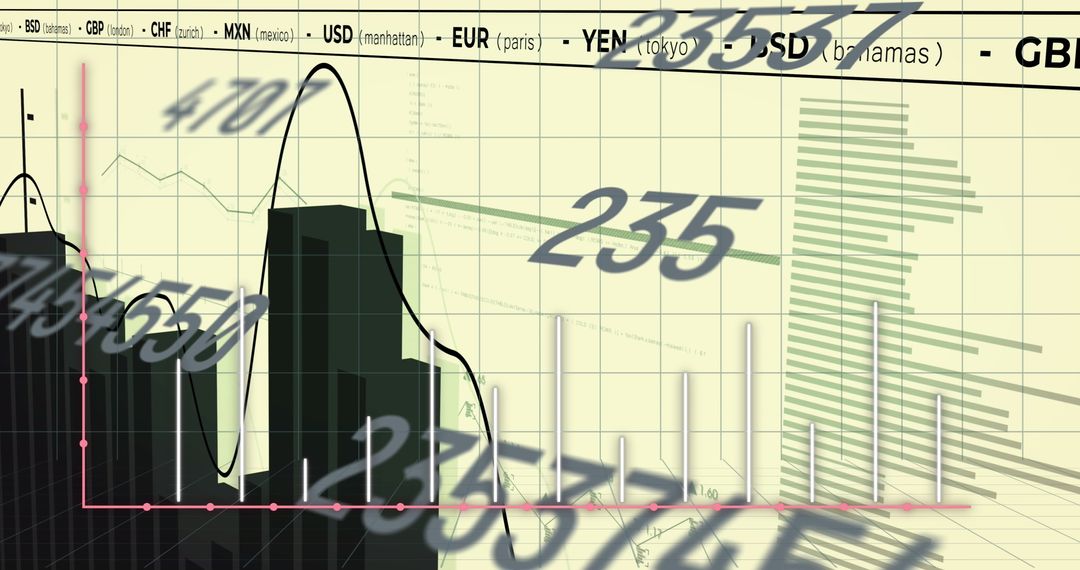
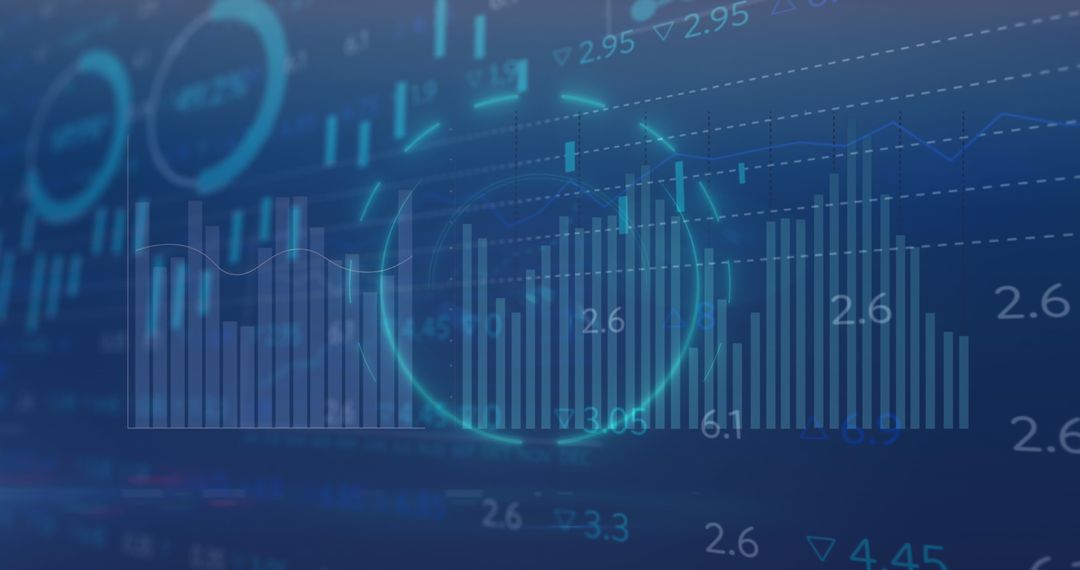
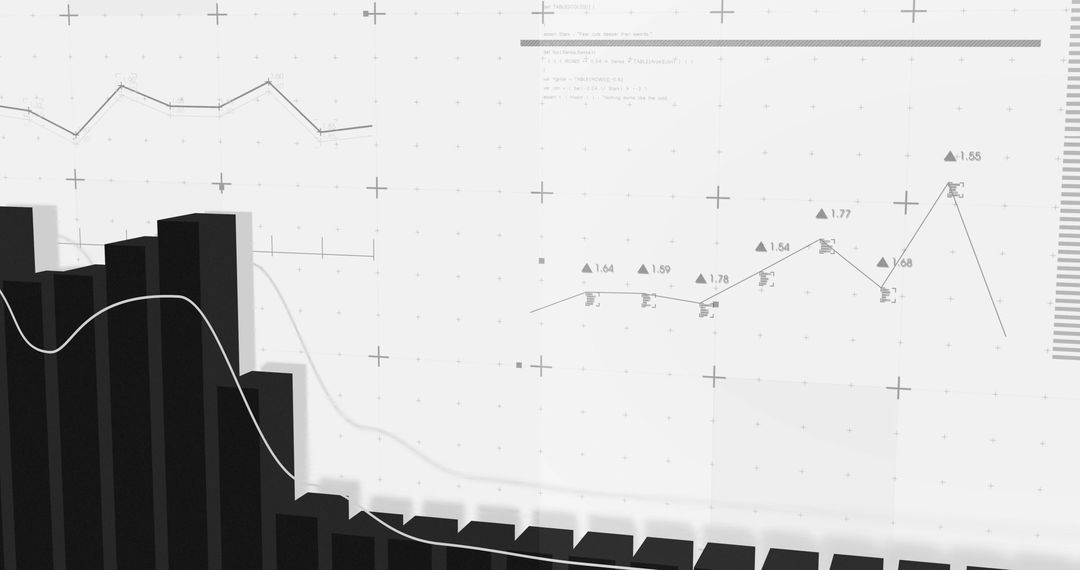
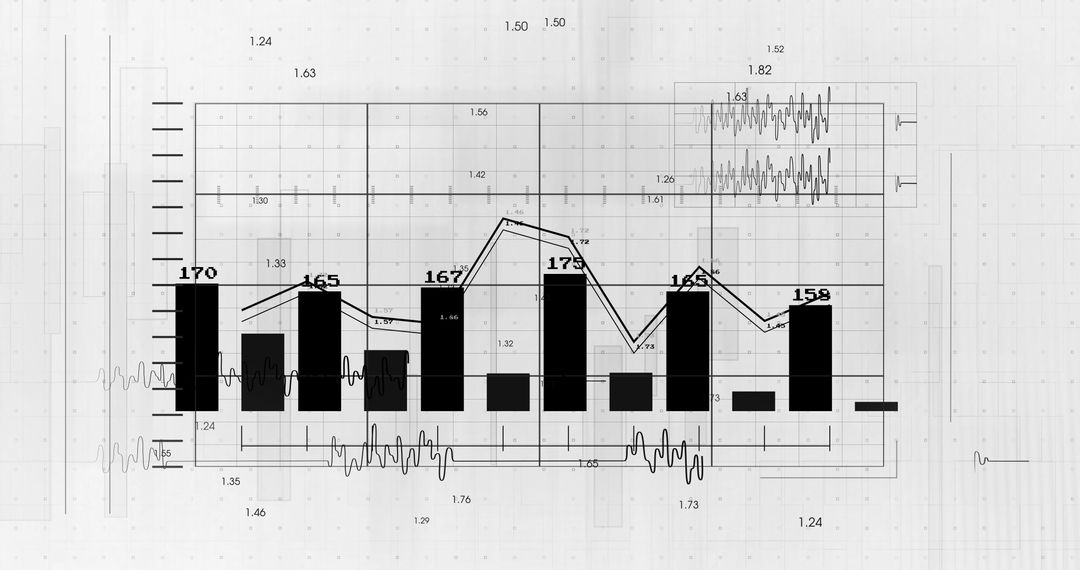
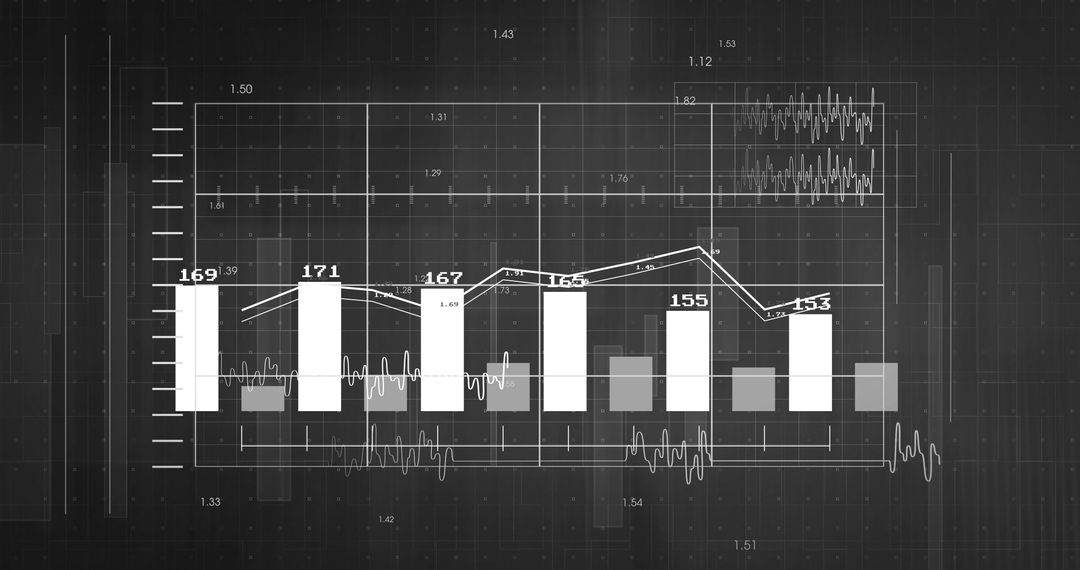
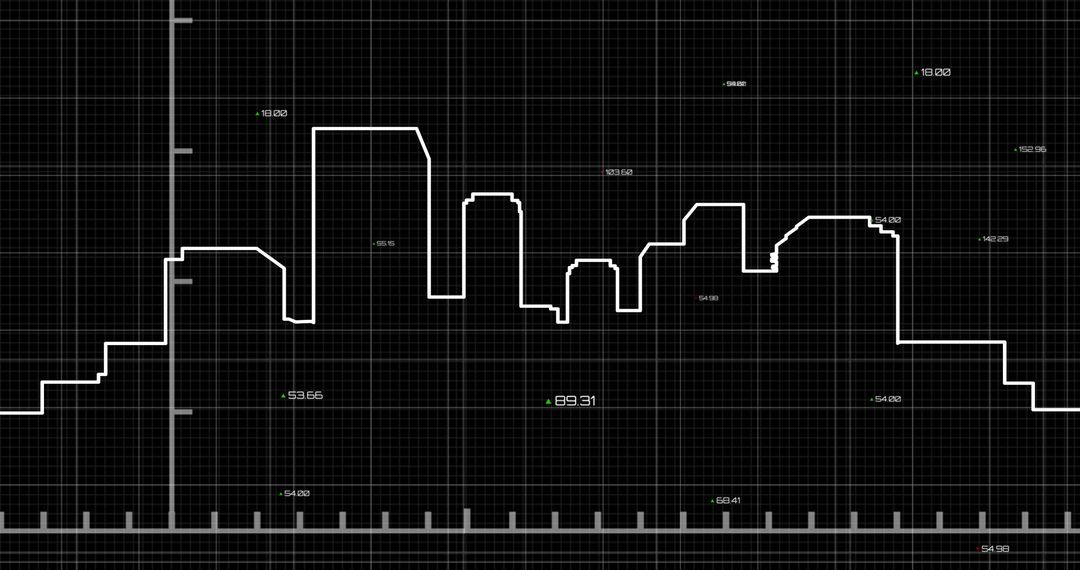
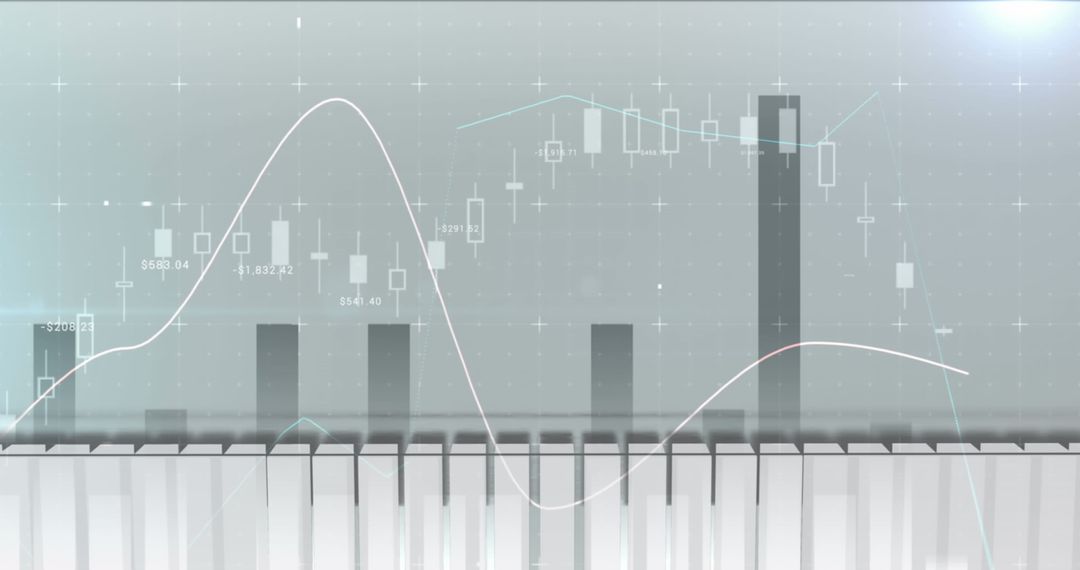
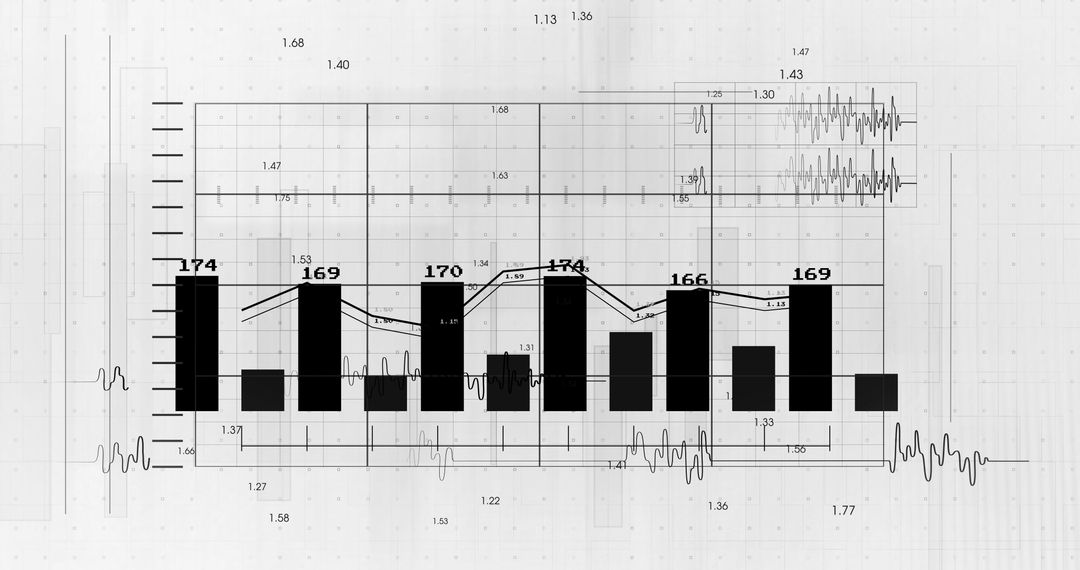
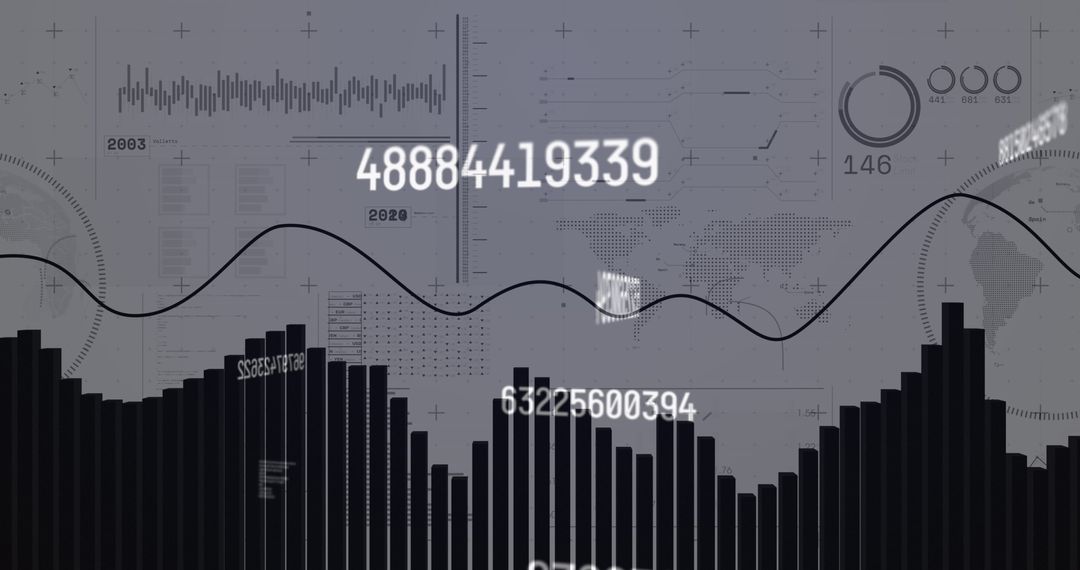
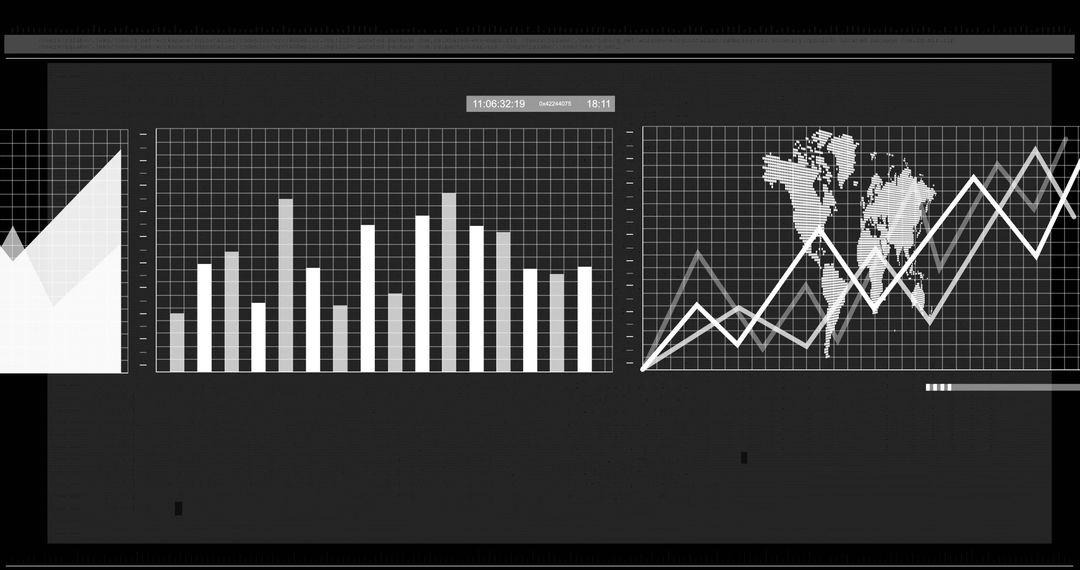
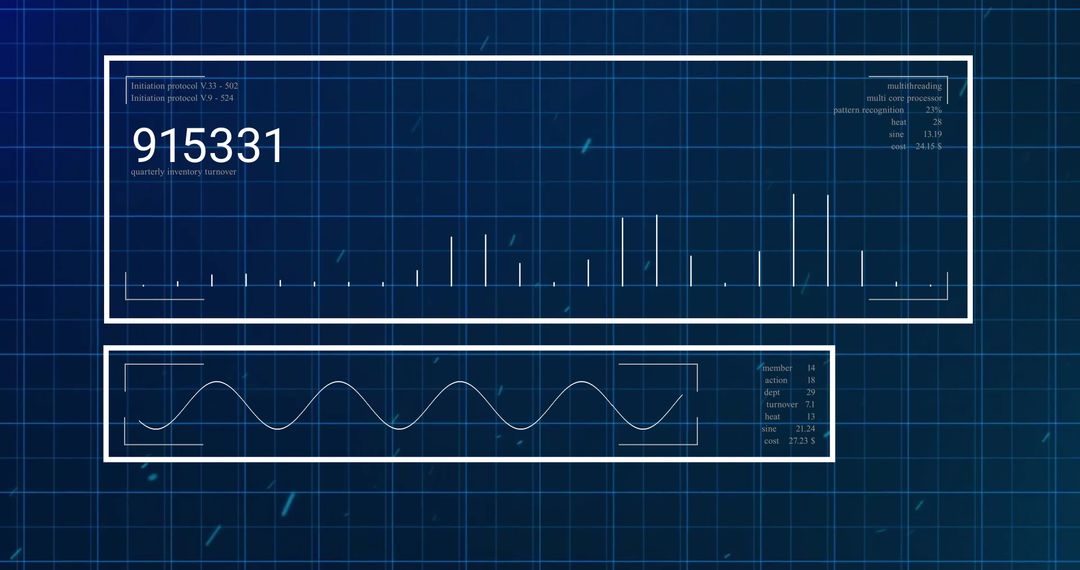
Visual representation of financial statistics with various chart types used for illustrating economic trends and analysis. Useful for financial reports, economic presentations, data analytics discussions, and educational materials covering economy.
Powered by 


0
downloads
downloads
Tags:
More
Credit Photo
If you would like to credit the Photo, here are some ways you can do so
Text Link
photo Link
<span class="text-link">
<span>
<a target="_blank" href=https://pikwizard.com/photo/modern-financial-data-visualization-with-charts-and-graphs/c72e84b618656dd46179ad27716cad2b/>PikWizard</a>
</span>
</span>
<span class="image-link">
<span
style="margin: 0 0 20px 0; display: inline-block; vertical-align: middle; width: 100%;"
>
<a
target="_blank"
href="https://pikwizard.com/photo/modern-financial-data-visualization-with-charts-and-graphs/c72e84b618656dd46179ad27716cad2b/"
style="text-decoration: none; font-size: 10px; margin: 0;"
>
<img src="https://pikwizard.com/pw/medium/c72e84b618656dd46179ad27716cad2b.jpg" style="margin: 0; width: 100%;" alt="" />
<p style="font-size: 12px; margin: 0;">PikWizard</p>
</a>
</span>
</span>
Free (free of charge)
Free for personal and commercial use.
Author: Authentic Images
Similar Free Stock Images

Premium


Premium


Premium


Premium


Premium


Premium


Premium


Premium


Premium


Premium


Premium


Premium


Premium


Premium


Premium


Premium


Premium


Premium


Premium


Premium


Premium


Premium


Premium


Premium