- Home >
- Stock Photos >
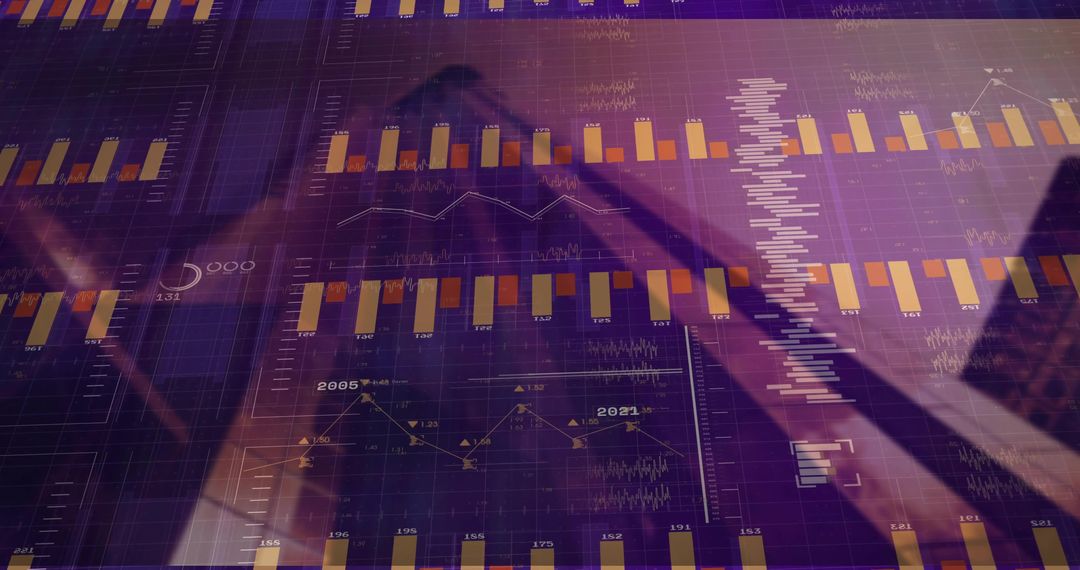
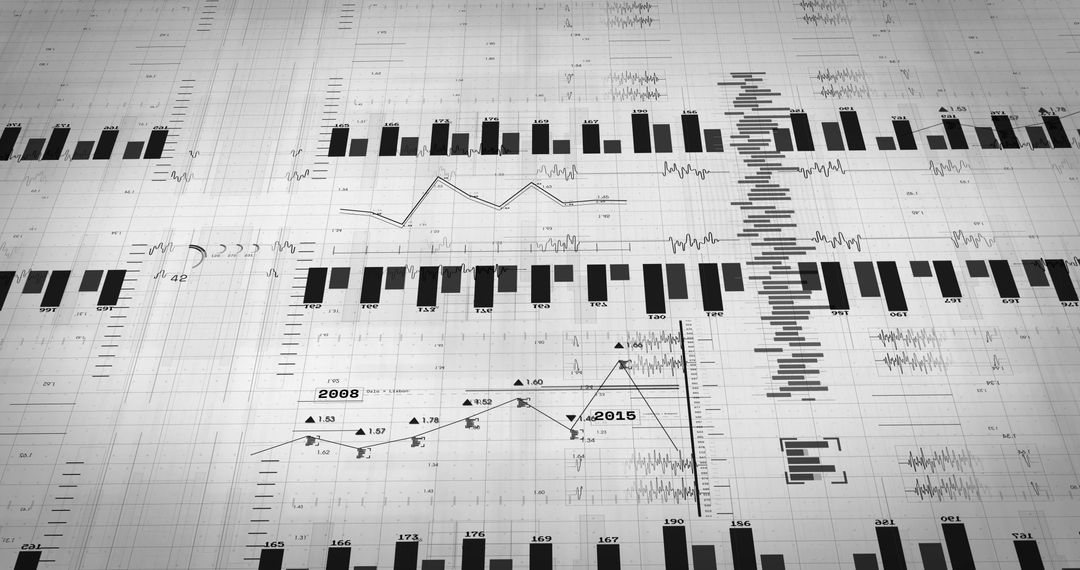
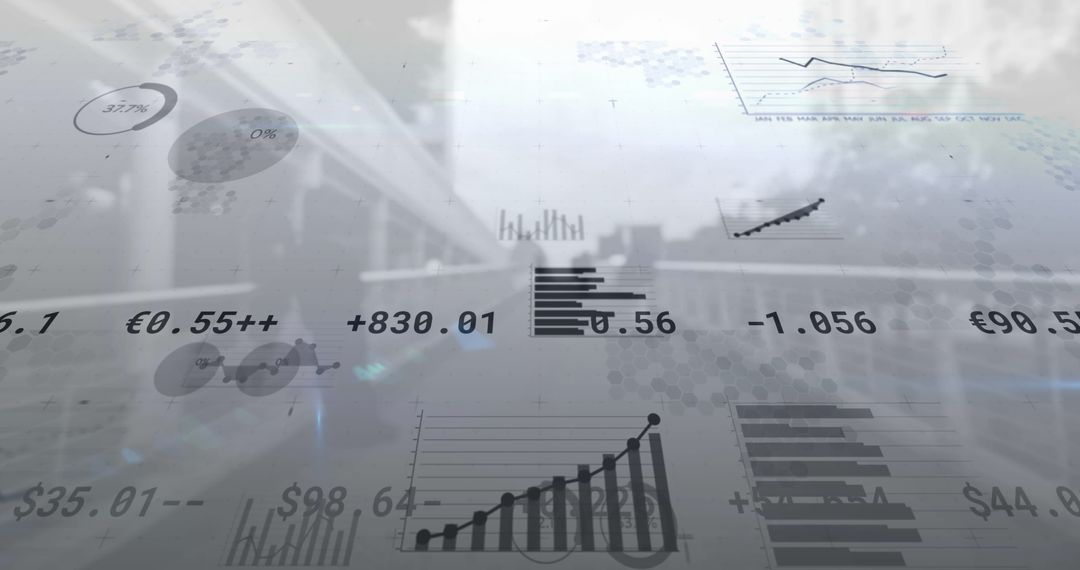
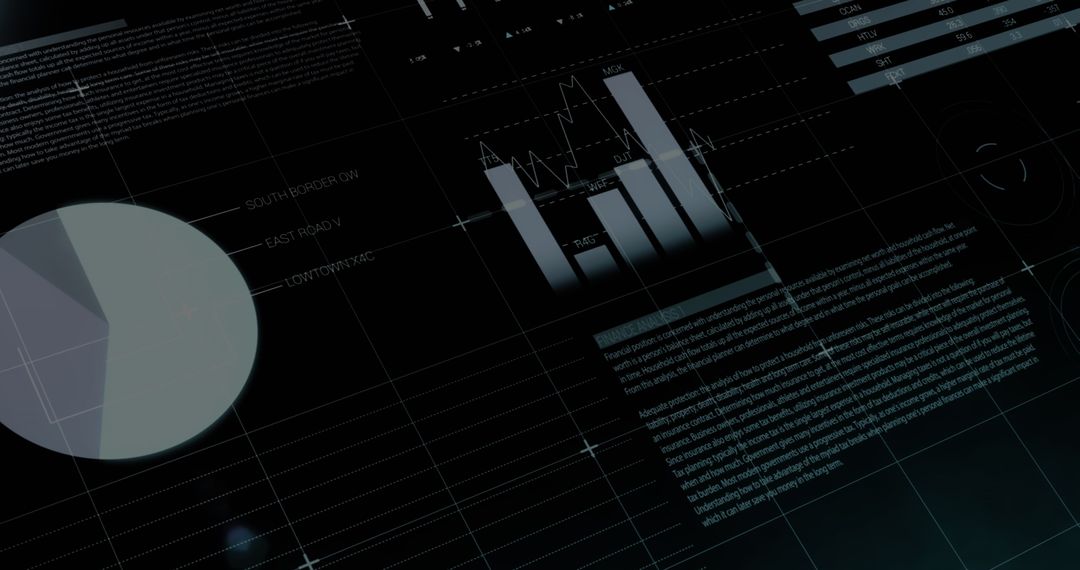
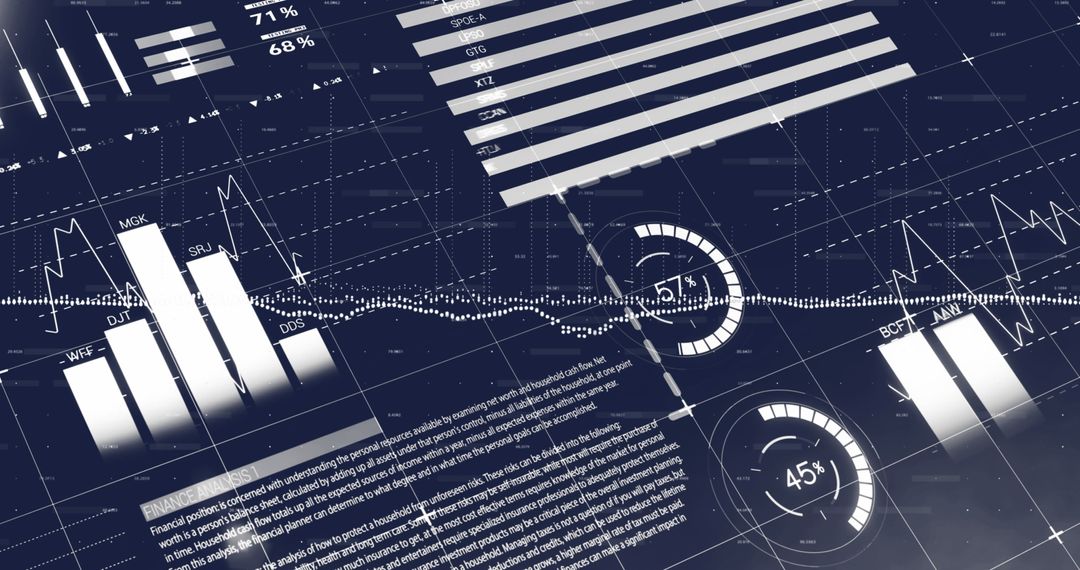
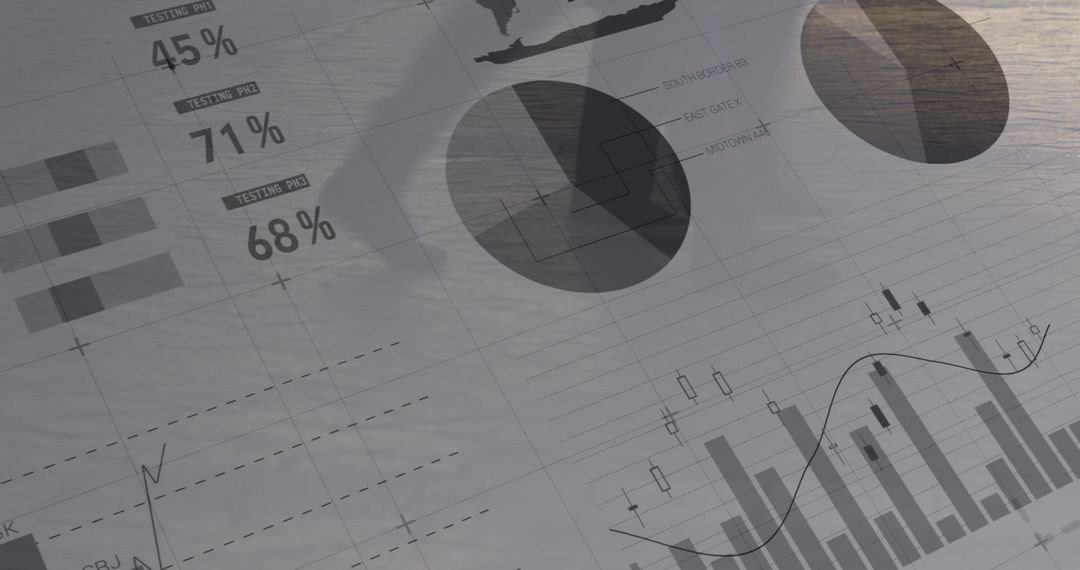
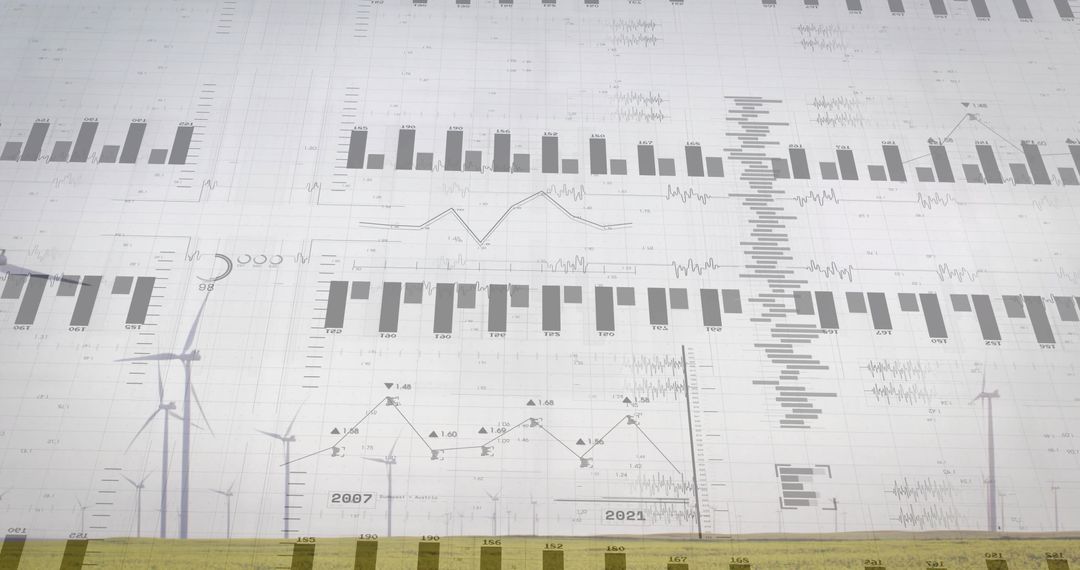
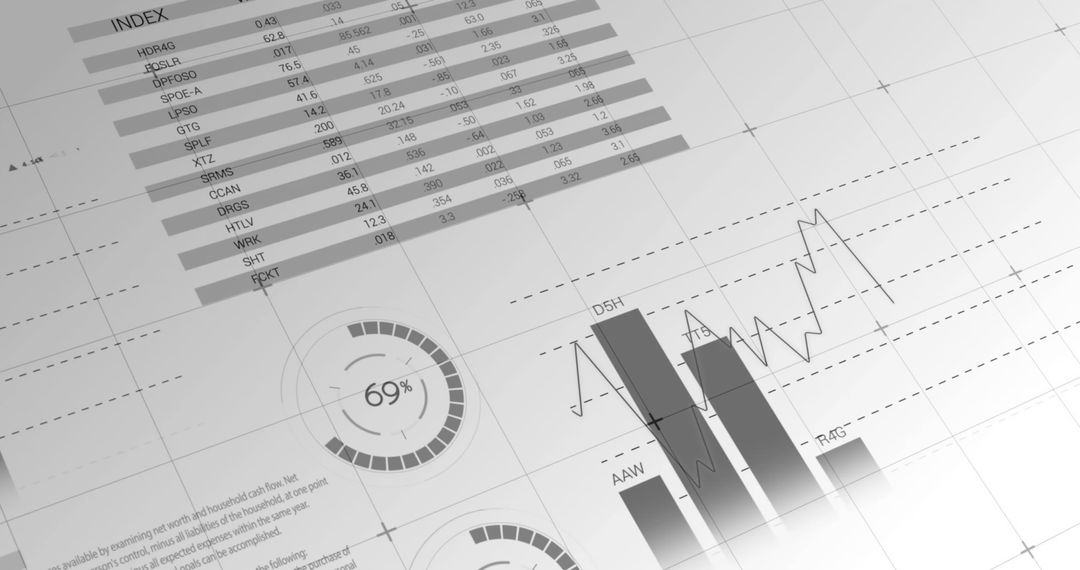
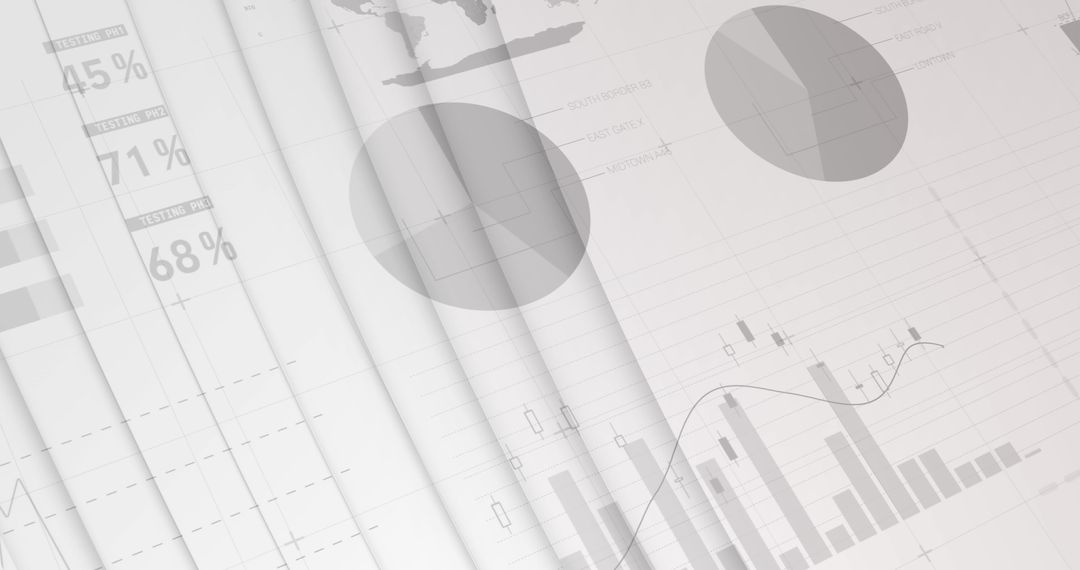
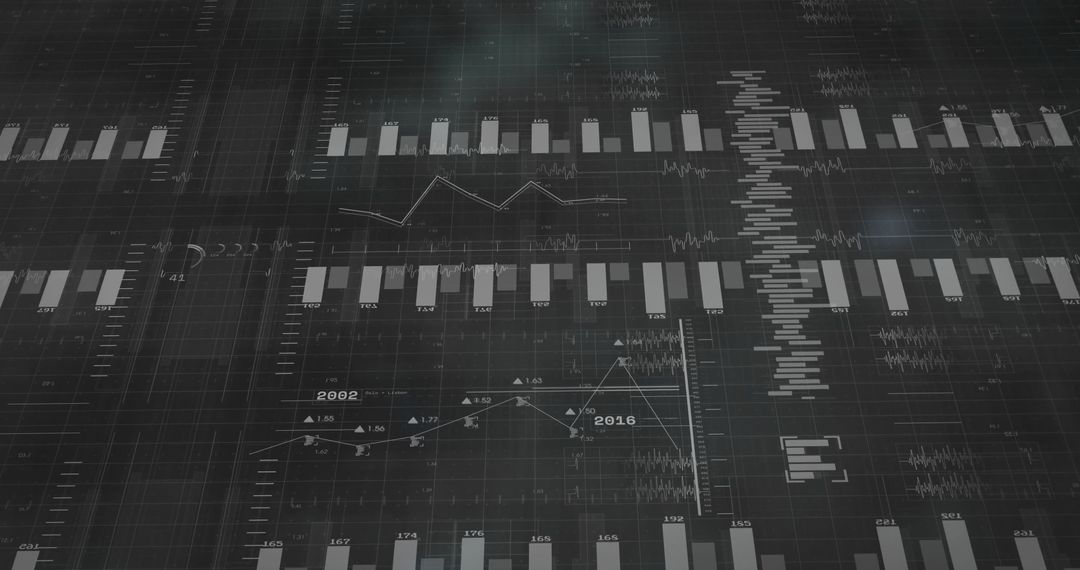
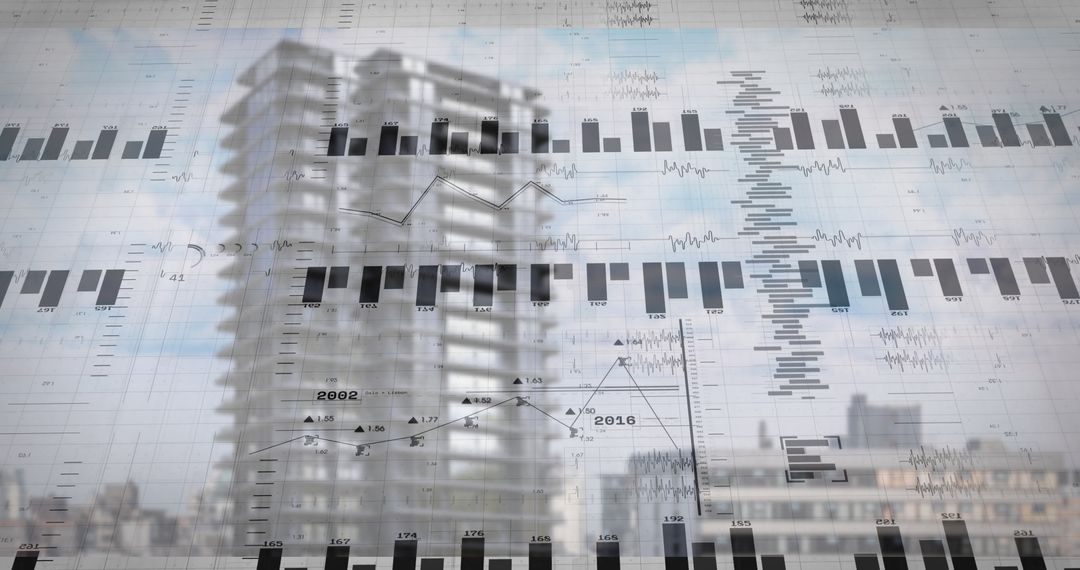
- Monochrome Financial Charts with Palm Leaf Shadow Casting Over Printed Analytics
Monochrome Financial Charts with Palm Leaf Shadow Casting Over Printed Analytics Image

Monochrome composition showing printed analytics sheets with bar charts, line graphs, histograms, and gridlines while palm leaf shadow casting diagonal pattern across data. High-contrast tonal range creating graphic, abstract feel that emphasizes trend lines, bars, and numeric labels. Ideal for business and finance themes: presentation slides, annual reports, financial blogs, corporate websites, social media posts, marketing collateral, and editorial layouts. Working well as background for headline text, data-driven articles, infographic headers, or concept visuals about data analysis, market trends, growth strategy, and analytics workflow.
Powered by  - Get 15% off with code: PIKWIZARD15


0
downloads
downloads
Tags:
More
Credit Photo
If you would like to credit the Photo, here are some ways you can do so
Text Link
photo Link
<span class="text-link">
<span>
<a target="_blank" href=https://pikwizard.com/photo/monochrome-financial-charts-with-palm-leaf-shadow-casting-over-printed-analytics/c82d354f06f53868aa45e6c11d813495/>PikWizard</a>
</span>
</span>
<span class="image-link">
<span
style="margin: 0 0 20px 0; display: inline-block; vertical-align: middle; width: 100%;"
>
<a
target="_blank"
href="https://pikwizard.com/photo/monochrome-financial-charts-with-palm-leaf-shadow-casting-over-printed-analytics/c82d354f06f53868aa45e6c11d813495/"
style="text-decoration: none; font-size: 10px; margin: 0;"
>
<img src="https://pikwizard.com/pw/medium/c82d354f06f53868aa45e6c11d813495.jpg" style="margin: 0; width: 100%;" alt="" />
<p style="font-size: 12px; margin: 0;">PikWizard</p>
</a>
</span>
</span>
Free (free of charge)
Free for personal and commercial use.
Author: Awesome Content
Similar Free Stock Images

Premium


Premium

Premium


Premium


Premium


Premium


Premium


Premium


Premium


Premium


Premium


Premium


Premium


Premium


Premium


Premium


Premium


Premium


Premium


Premium


Premium


Premium


Premium


Premium