- Home >
- Stock Photos >
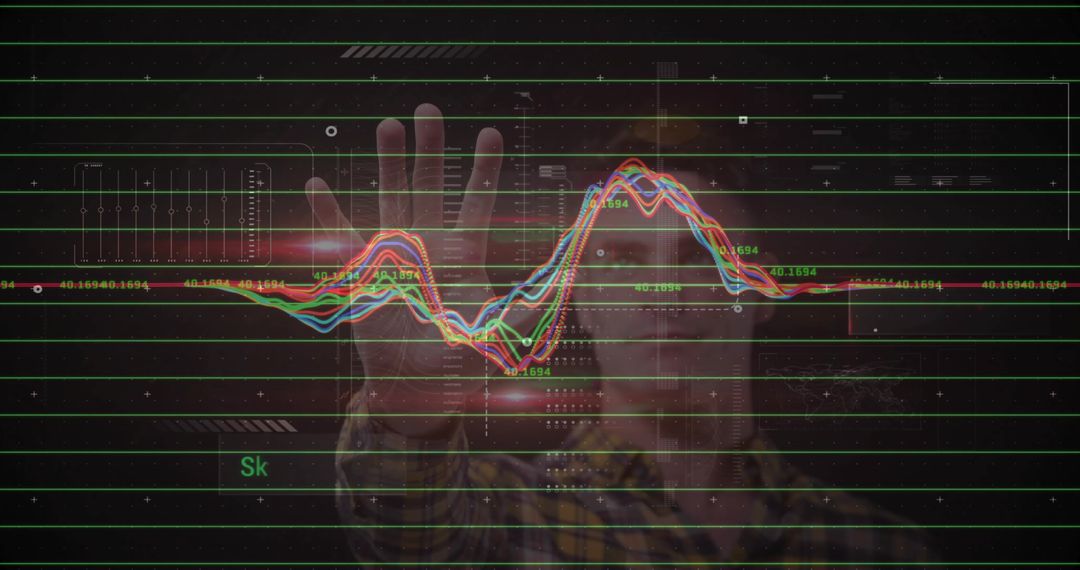
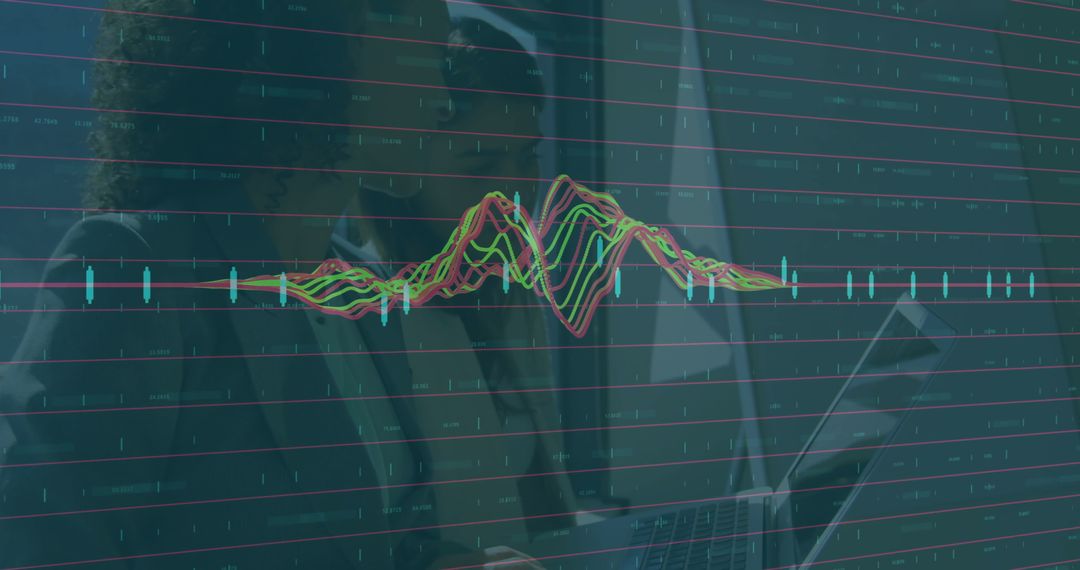
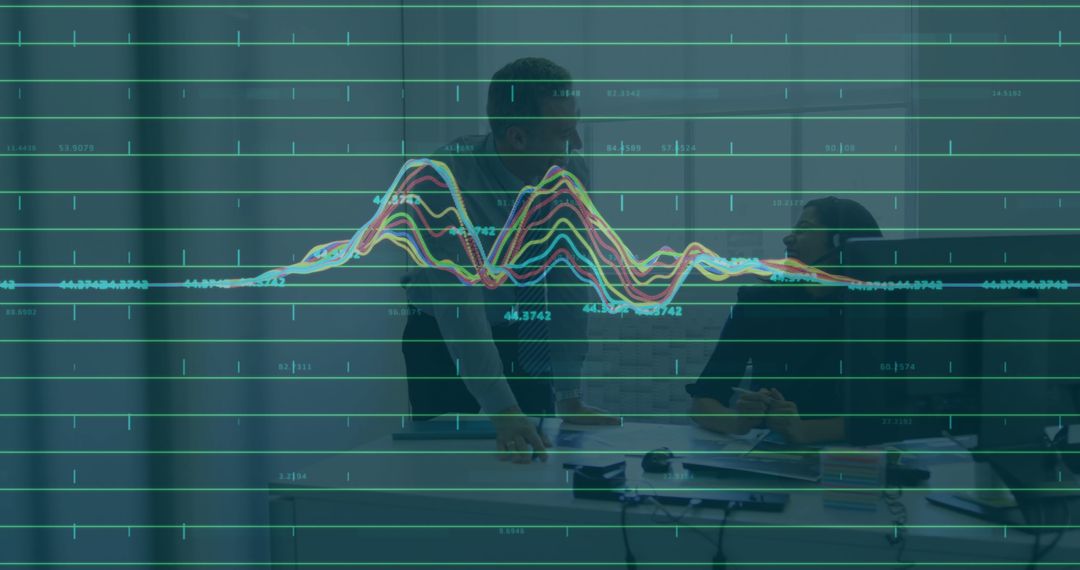
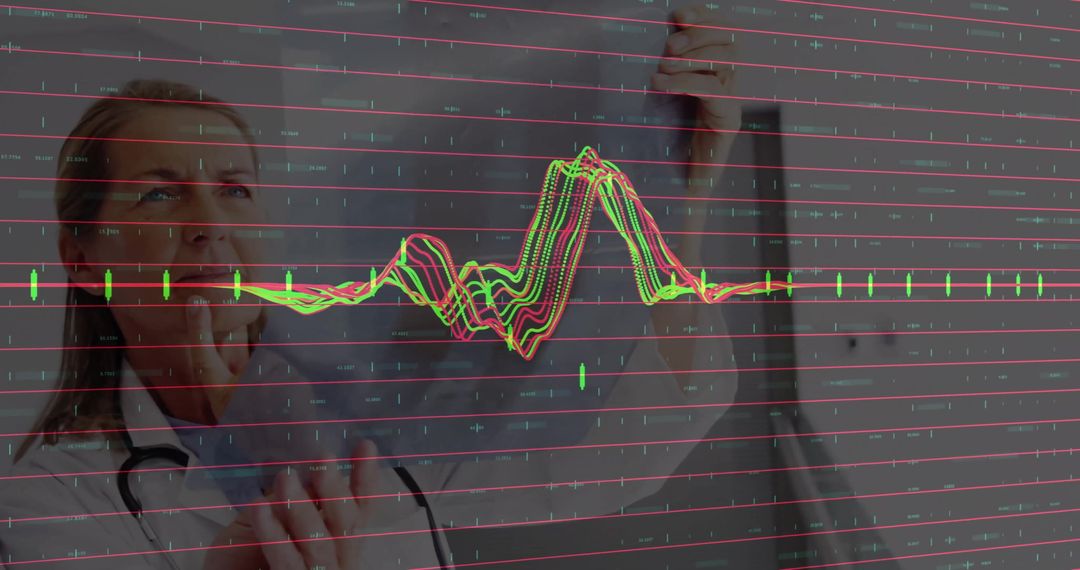
- Multicolor Line Chart Overlay on Glass Panel Tracking Business Trends in Office
Multicolor Line Chart Overlay on Glass Panel Tracking Business Trends in Office Image

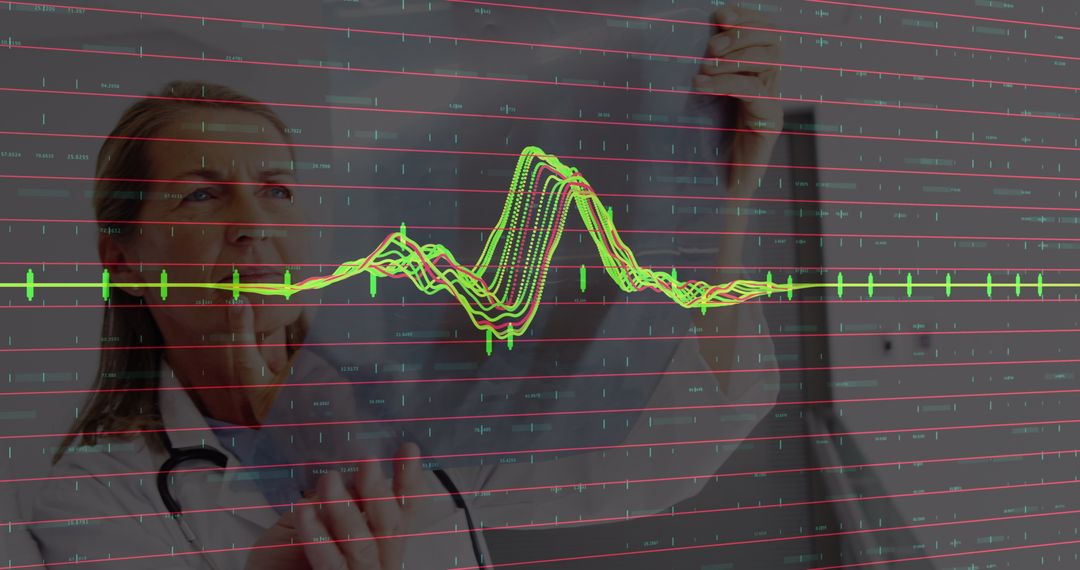
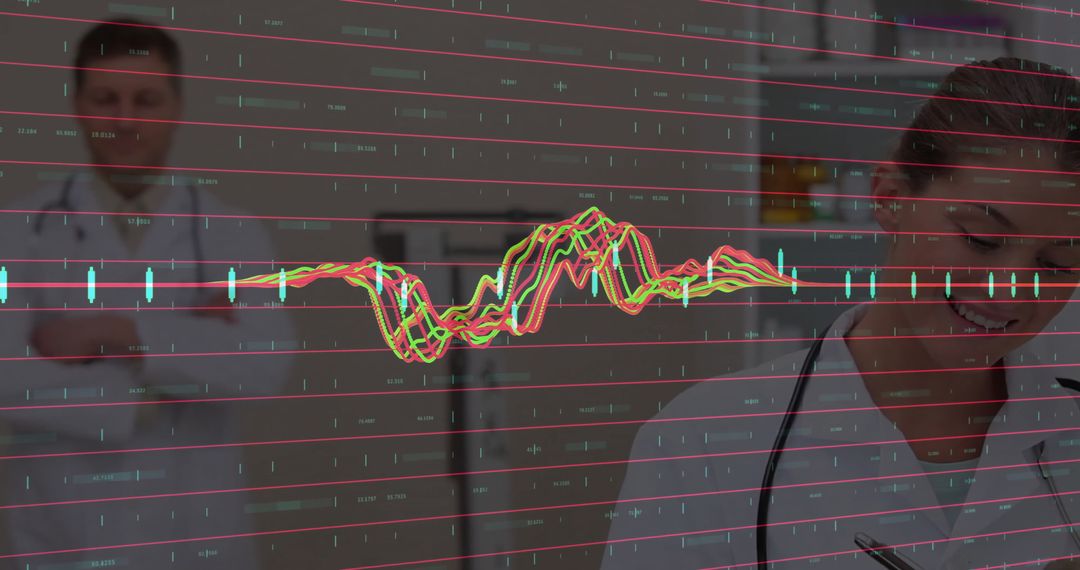
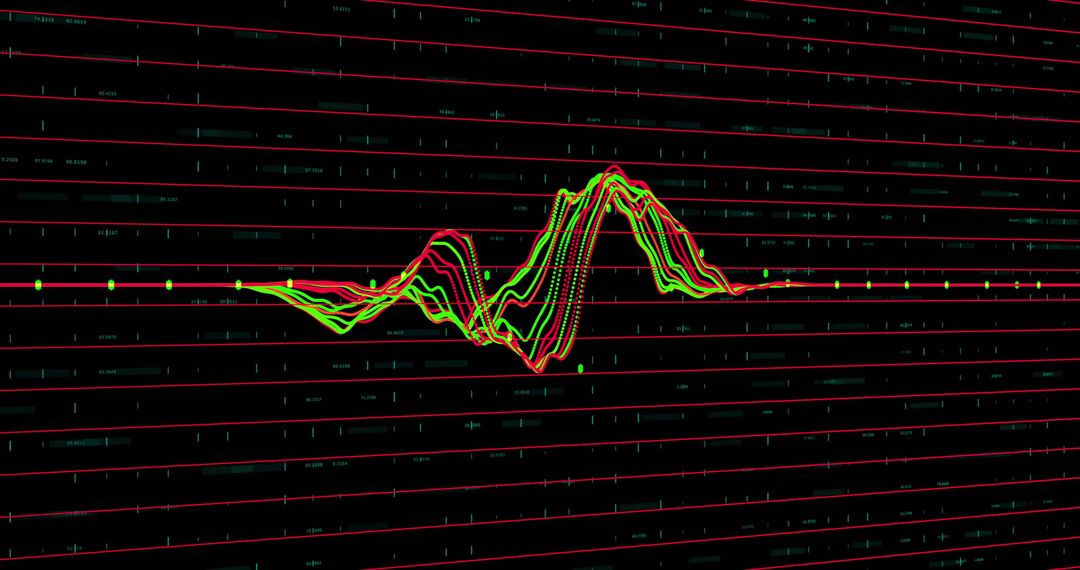
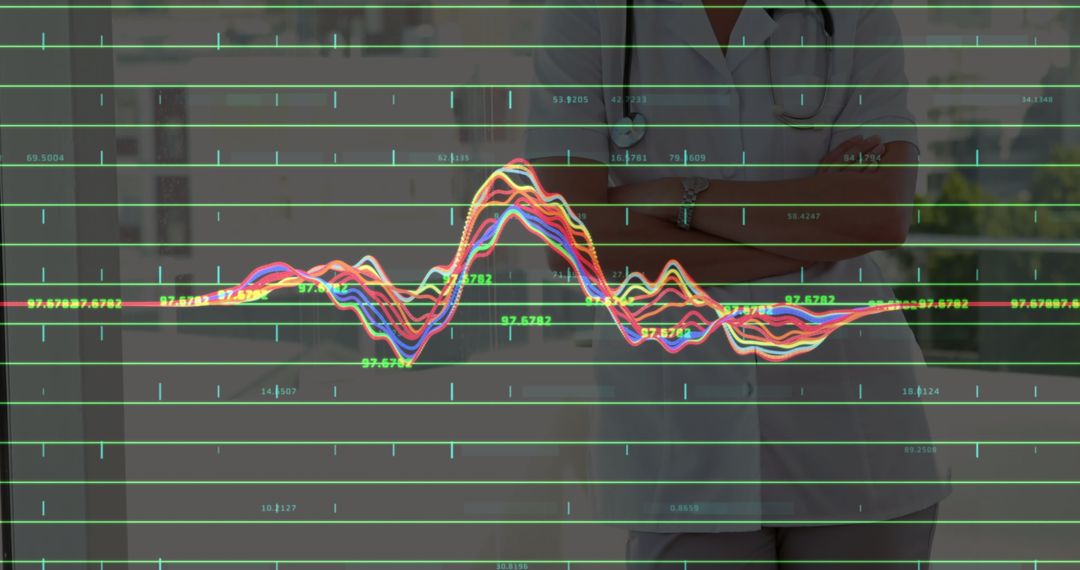
Displaying multicolor line chart overlay on transparent glass panel with blurred colleagues and workstation monitors in background. Neon greens, blues, and warm highlights contrasting dark office tones, creating modern high-tech atmosphere. Central graph and horizontal grid lines providing clear focal point while surrounding negative space allowing placement of text, logos, or data callouts. Perfect for presentations, website hero banners, dashboard demos, financial reports, analytics blogs, fintech marketing, investor decks, and training materials. Compositing with branded colors or custom data for product pages, whitepapers, or social media campaigns.
Powered by  - Get 15% off with code: PIKWIZARD15


0
downloads
downloads
Tags:
More
Credit Photo
If you would like to credit the Photo, here are some ways you can do so
Text Link
photo Link
<span class="text-link">
<span>
<a target="_blank" href=https://pikwizard.com/photo/multicolor-line-chart-overlay-on-glass-panel-tracking-business-trends-in-office/37b6ca59f7fec3b032886674c33e363c/>PikWizard</a>
</span>
</span>
<span class="image-link">
<span
style="margin: 0 0 20px 0; display: inline-block; vertical-align: middle; width: 100%;"
>
<a
target="_blank"
href="https://pikwizard.com/photo/multicolor-line-chart-overlay-on-glass-panel-tracking-business-trends-in-office/37b6ca59f7fec3b032886674c33e363c/"
style="text-decoration: none; font-size: 10px; margin: 0;"
>
<img src="https://pikwizard.com/pw/medium/37b6ca59f7fec3b032886674c33e363c.jpg" style="margin: 0; width: 100%;" alt="" />
<p style="font-size: 12px; margin: 0;">PikWizard</p>
</a>
</span>
</span>
Free (free of charge)
Free for personal and commercial use.
Author: Creative Art
Similar Free Stock Images
Premium


Premium


Premium


Premium


Premium


Premium


Premium


Premium


Premium


Premium


Premium


Premium


Premium


Premium


Premium


Premium


Premium


Premium


Premium


Premium


Premium


Premium


Premium


Premium