- Home >
- Stock Photos >
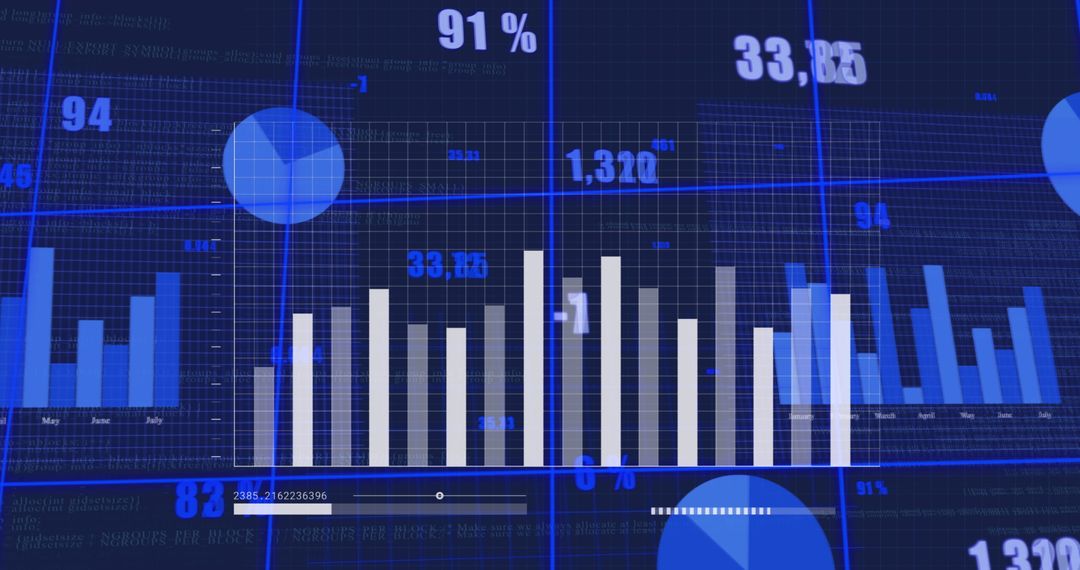
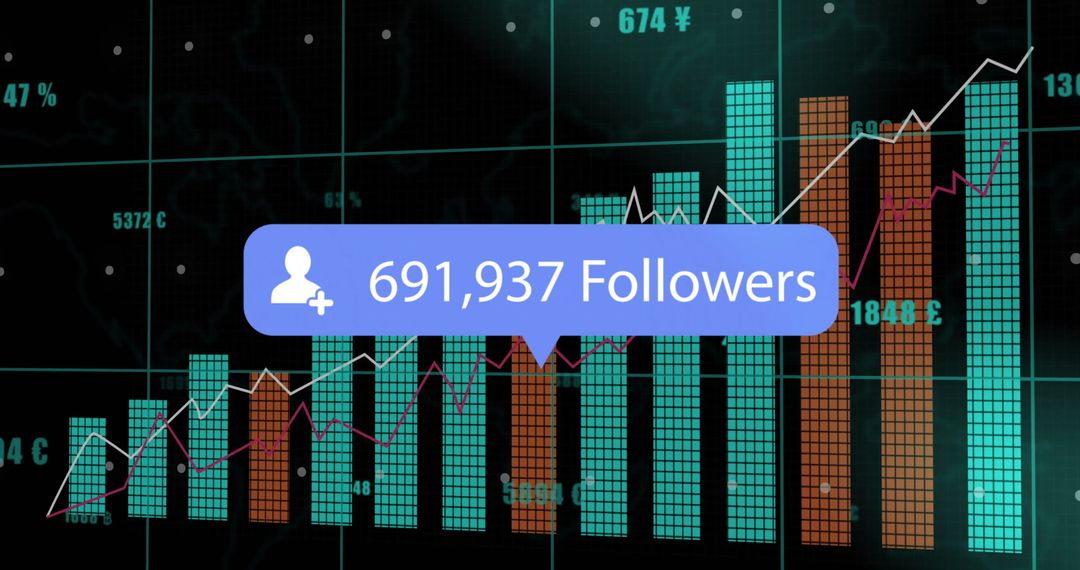
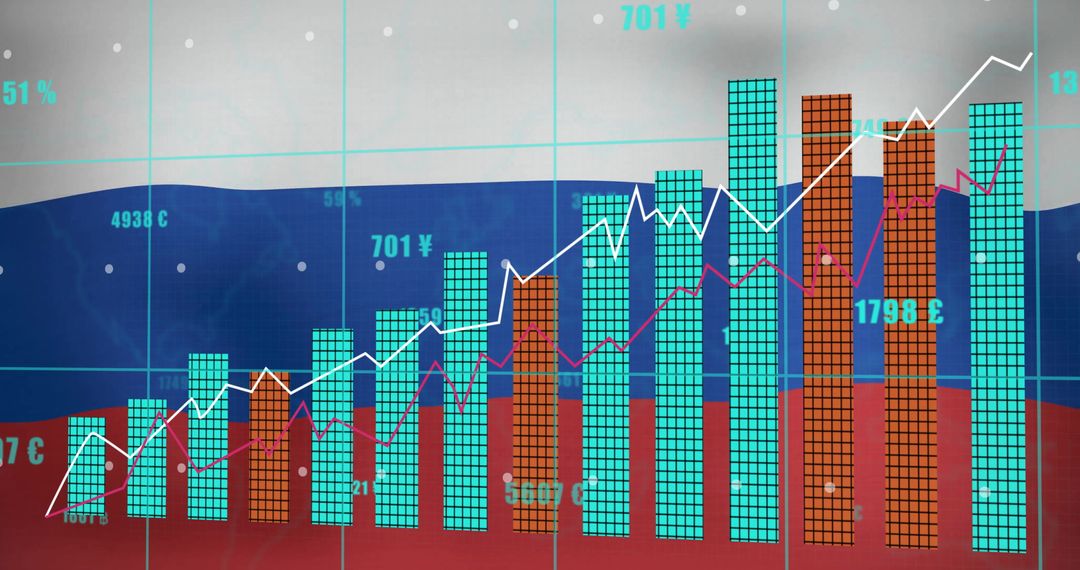
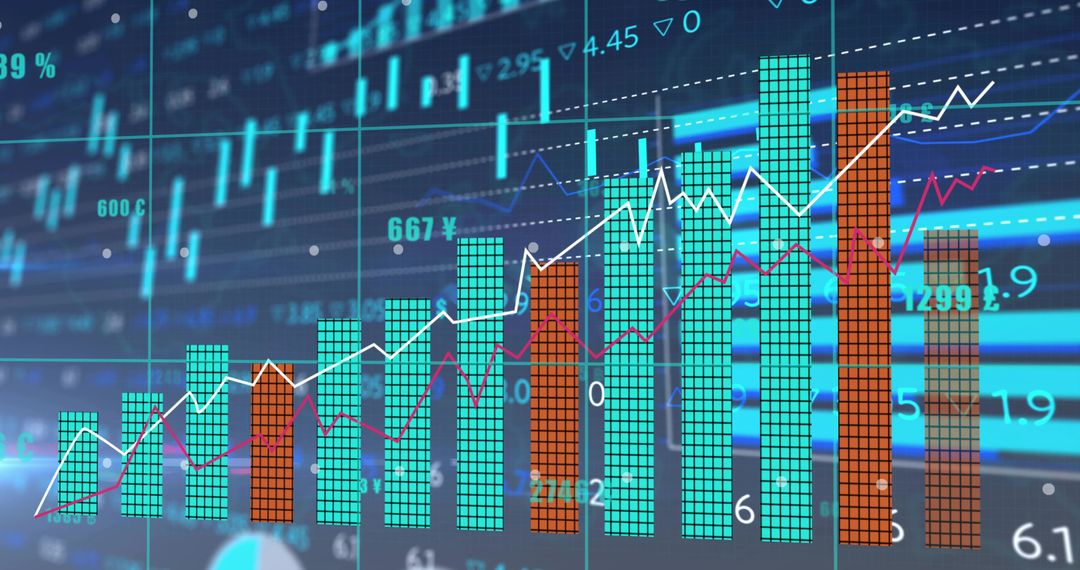
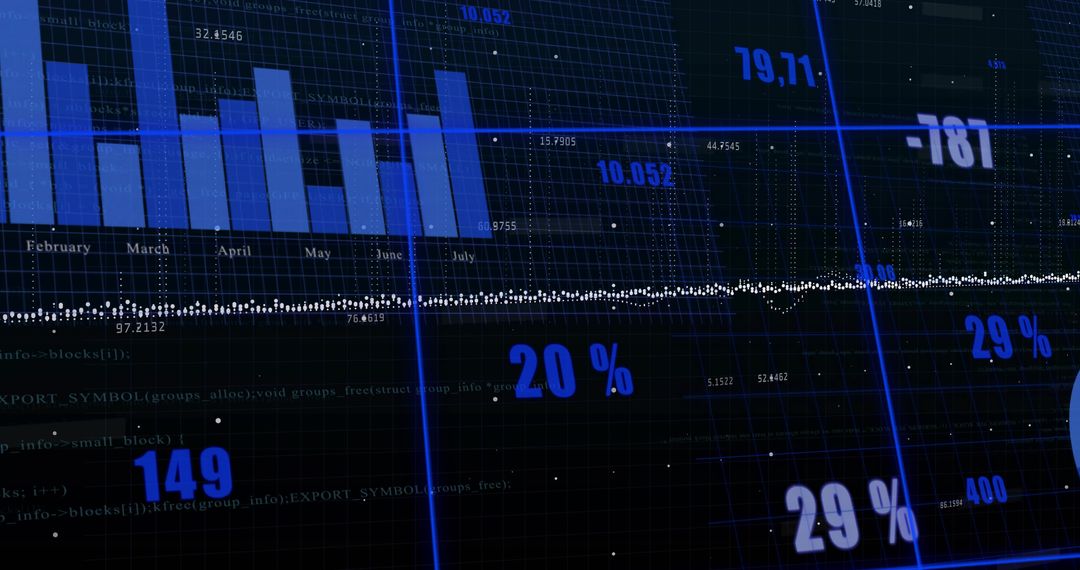
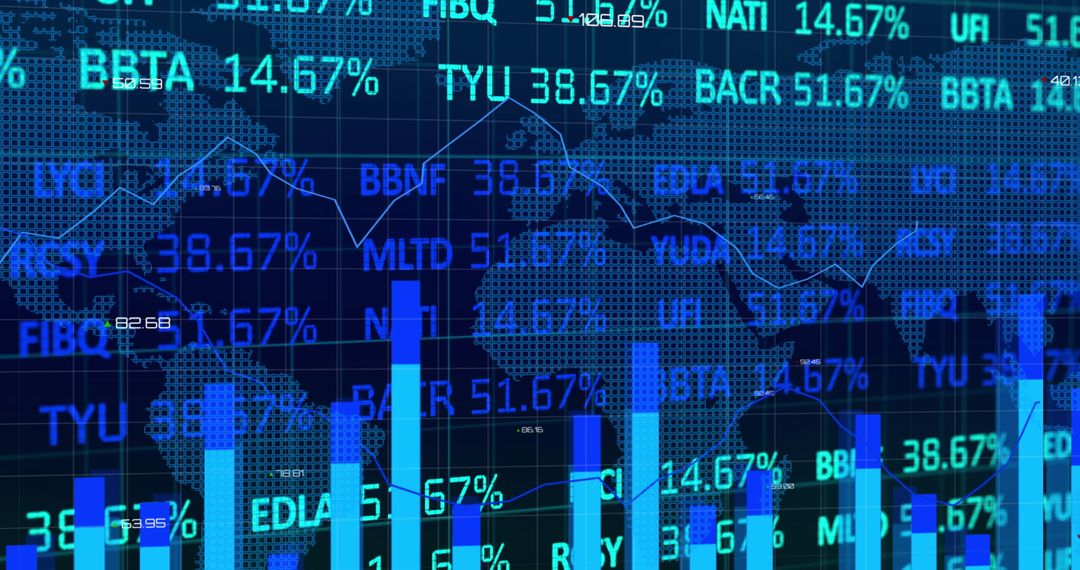
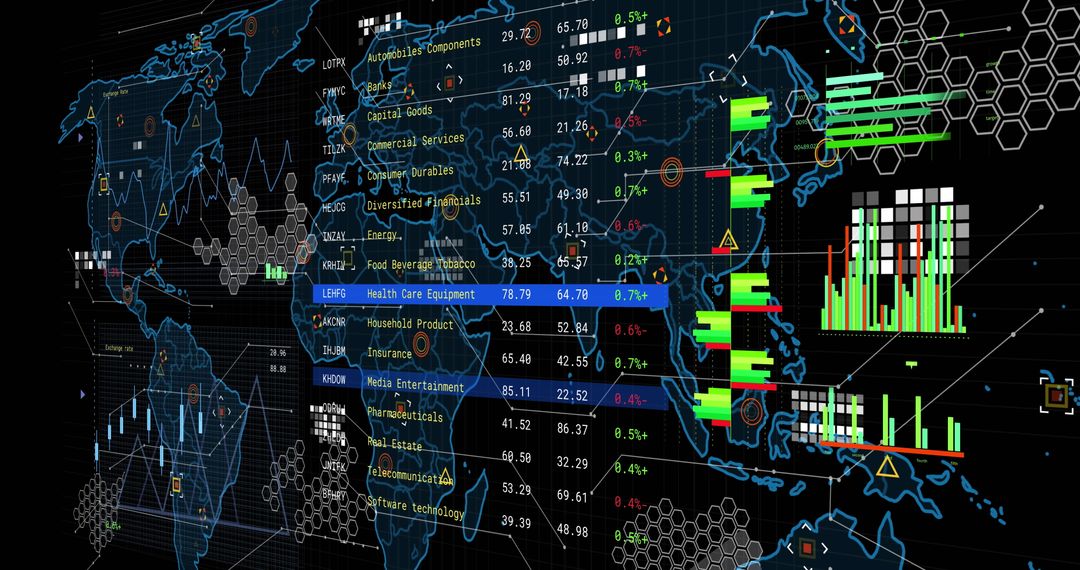
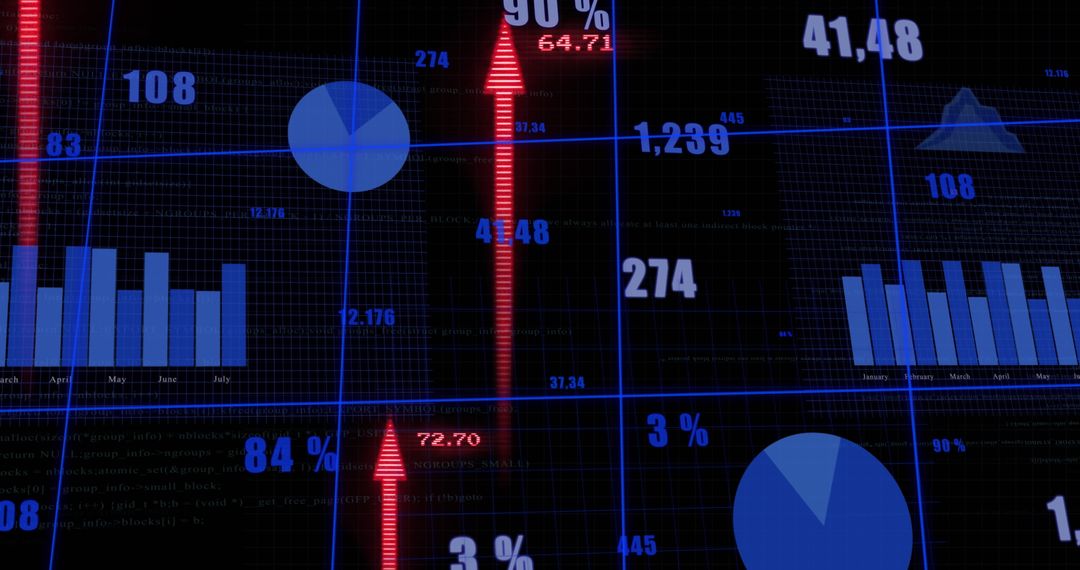
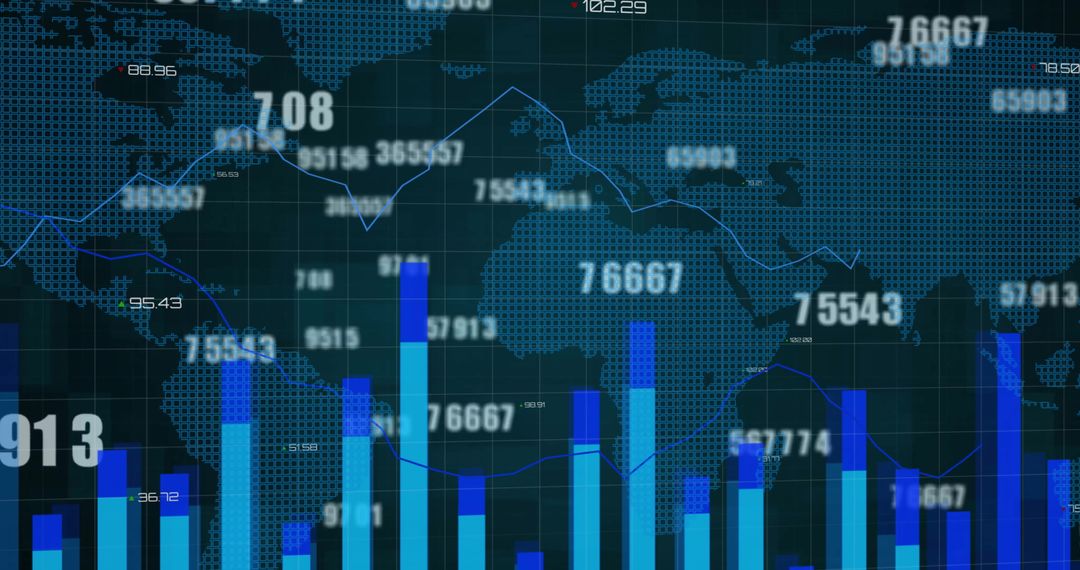
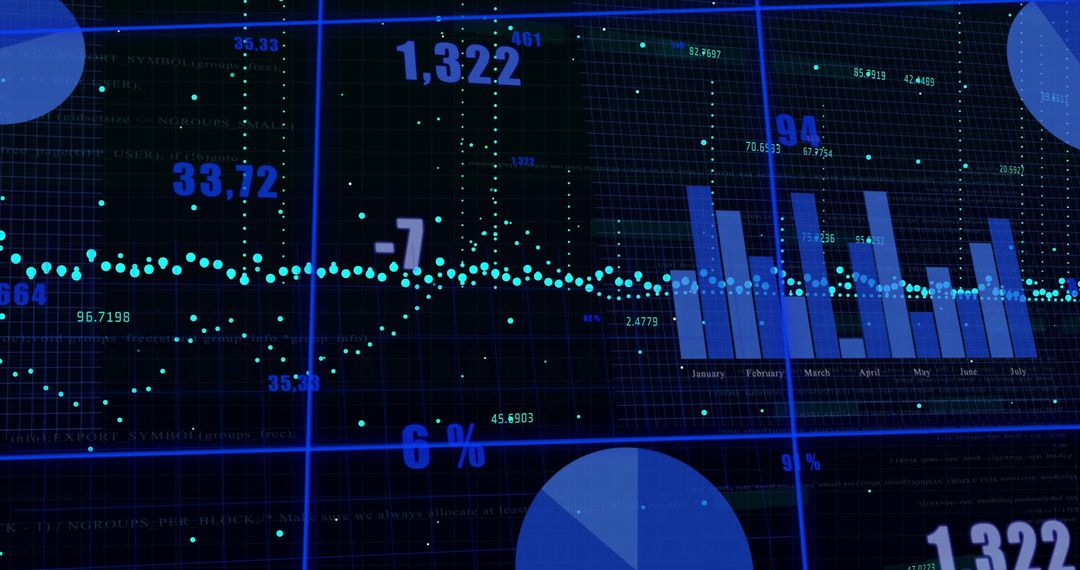
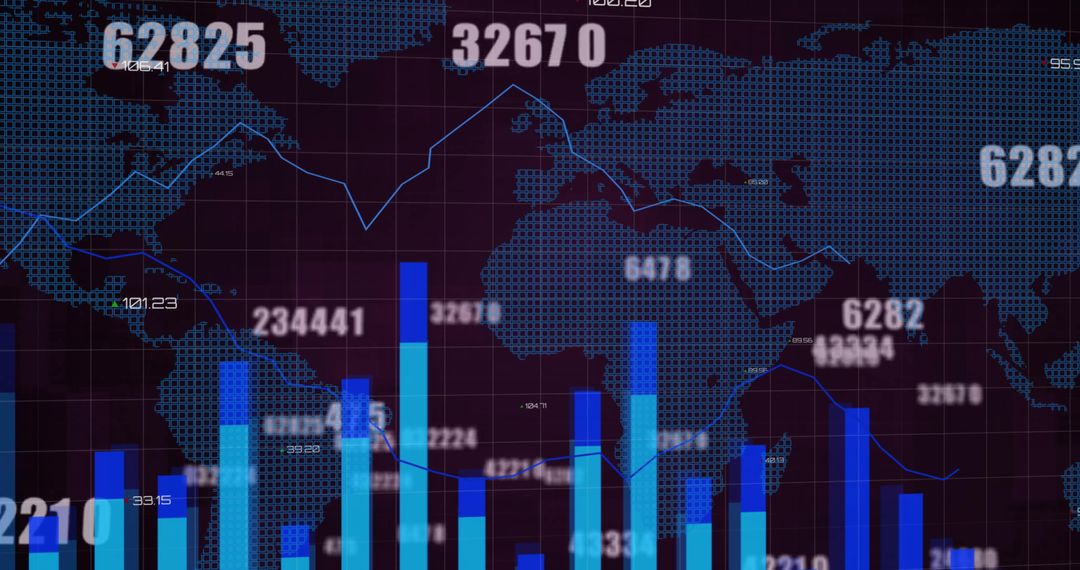
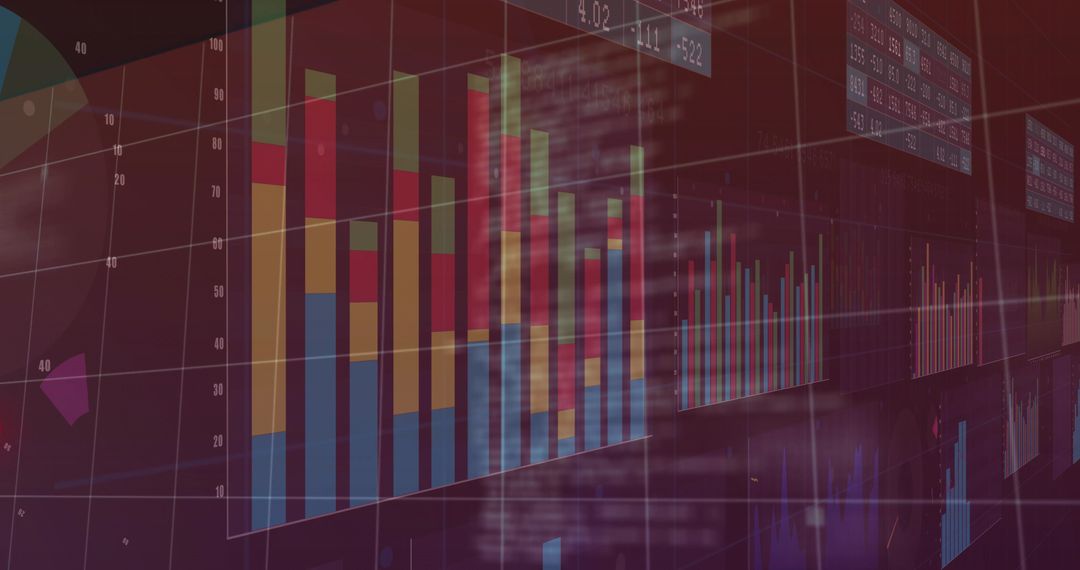
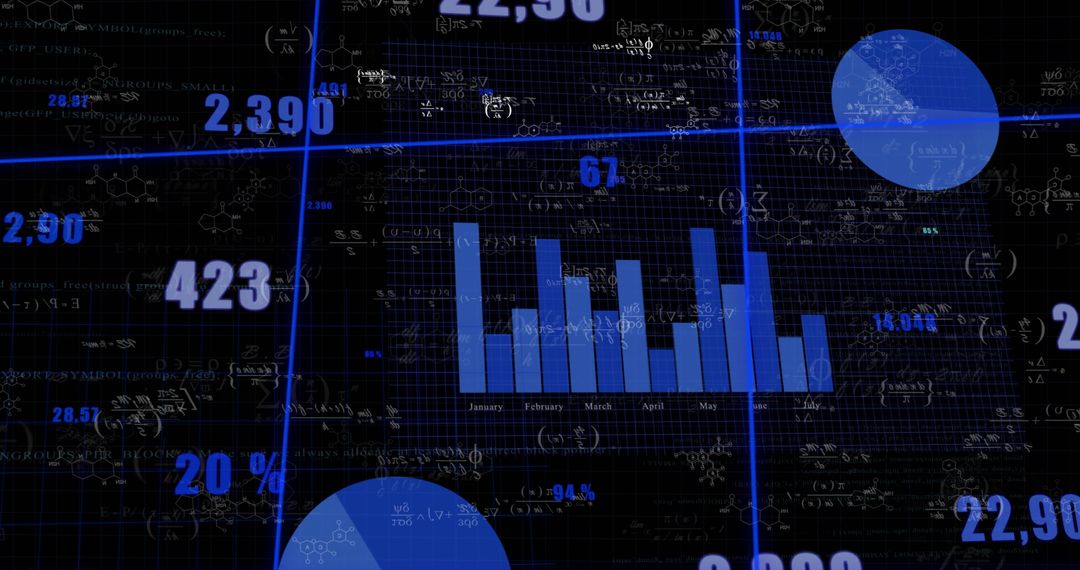
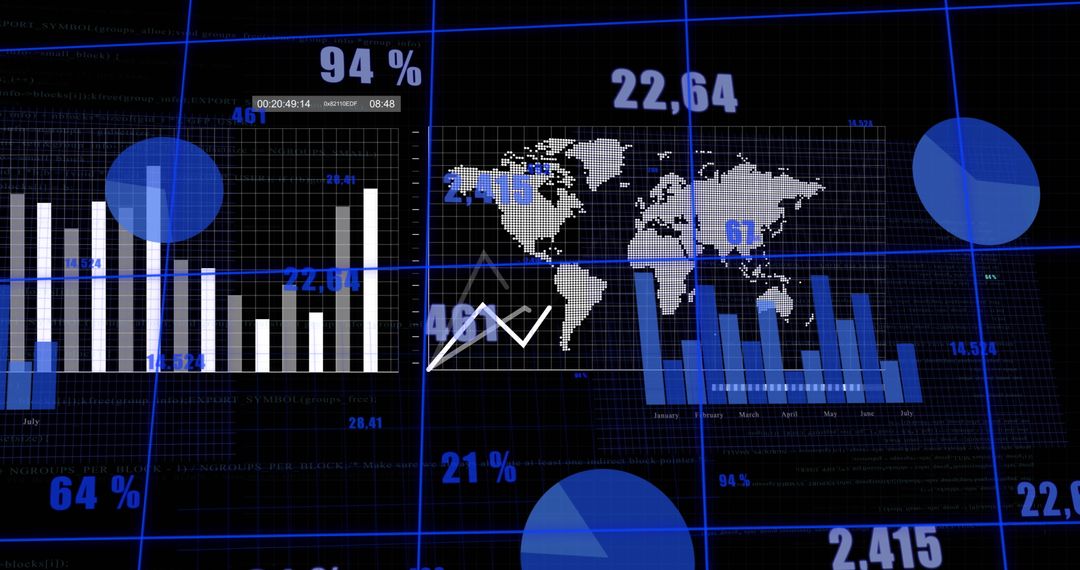
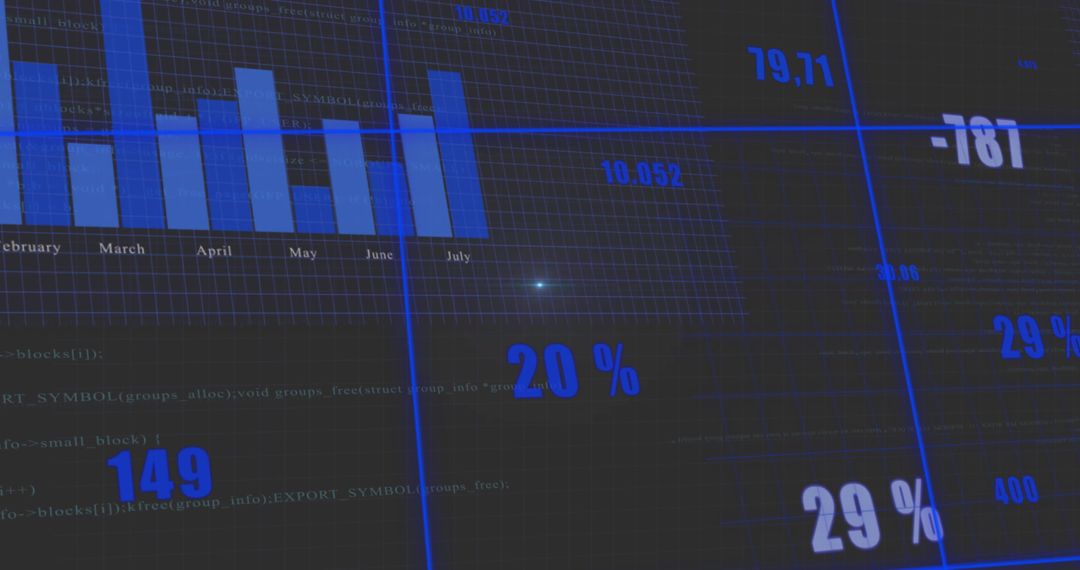
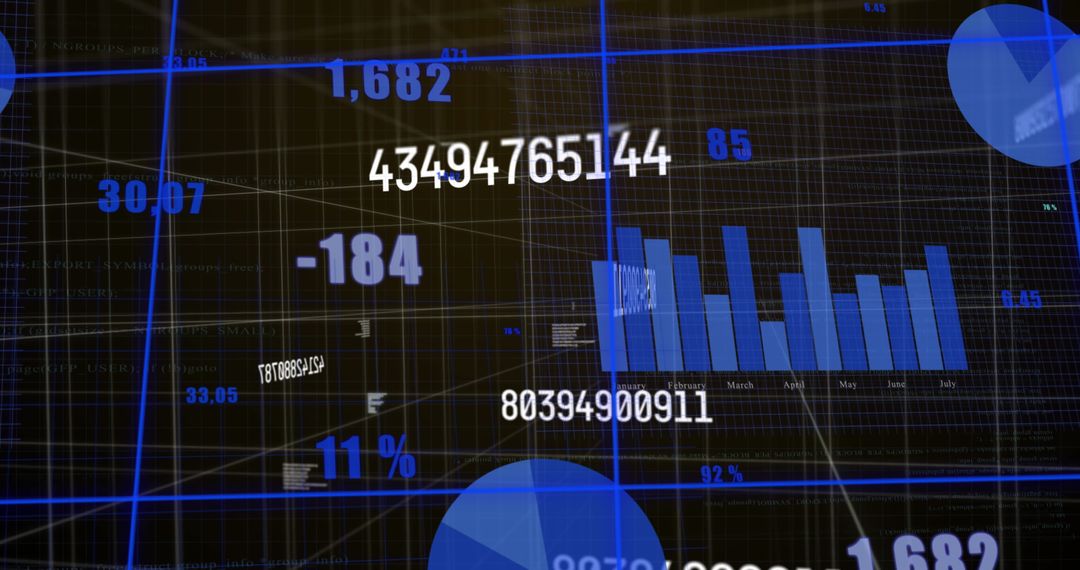
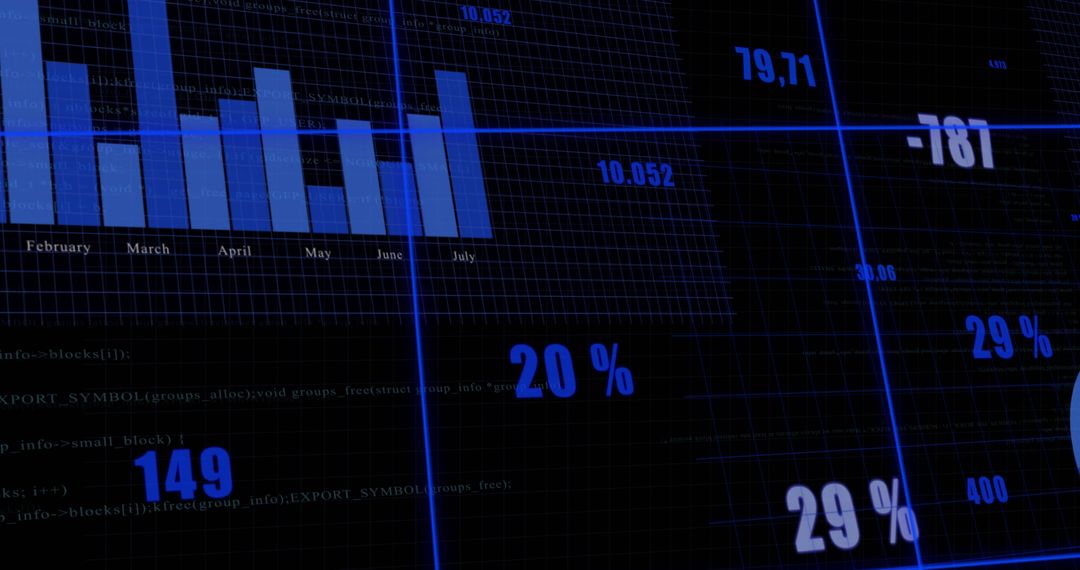
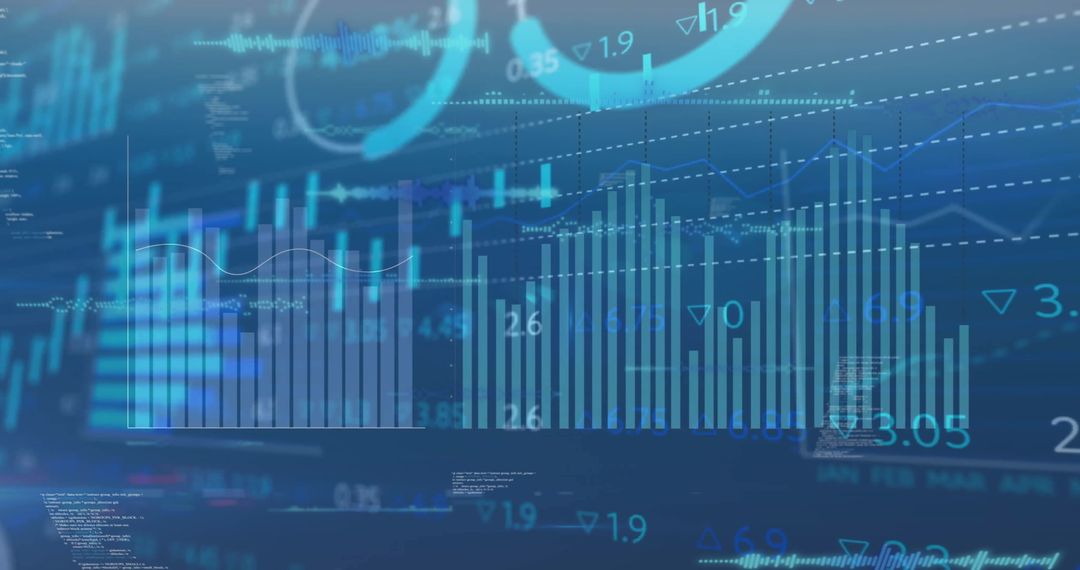
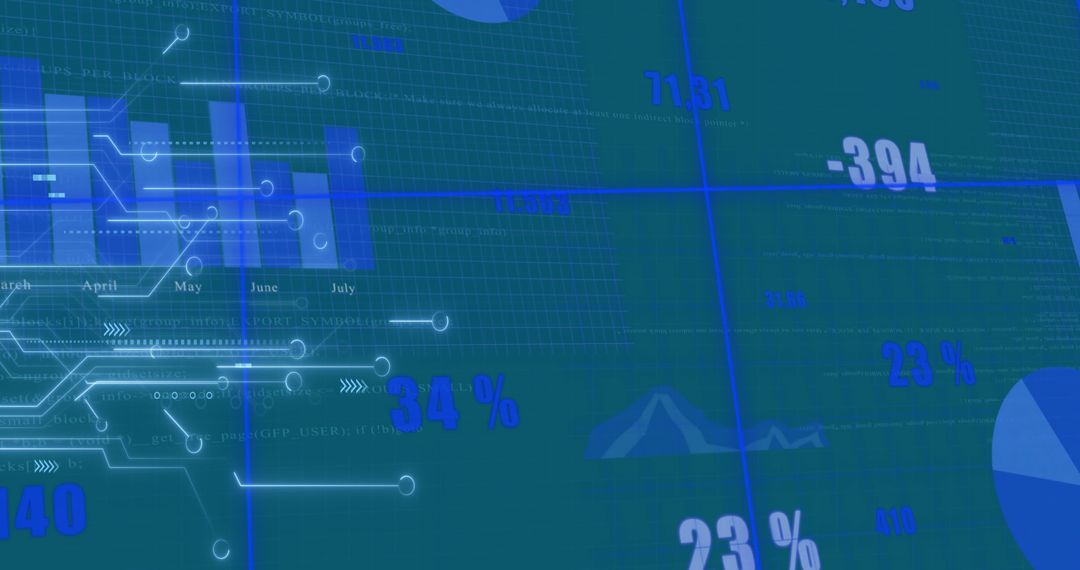
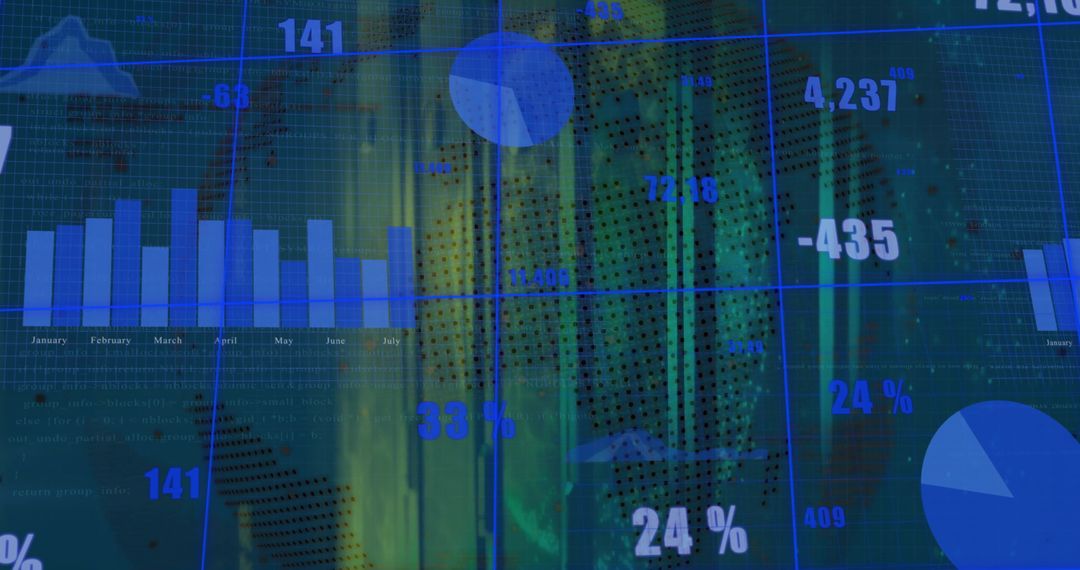
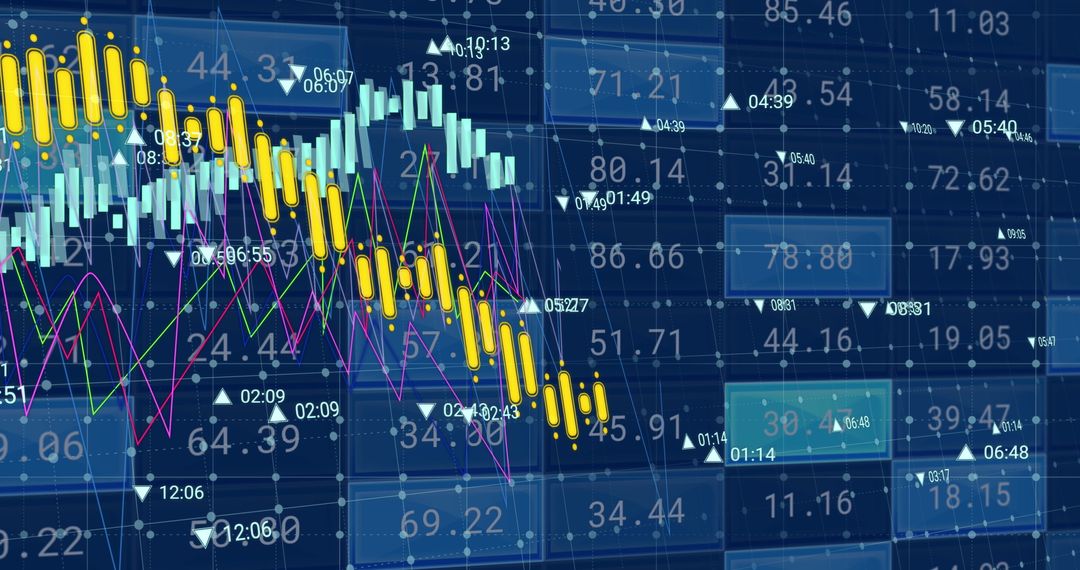
- Neon analytics dashboard displaying stacked bar charts, line graphs and percentage metrics
Neon analytics dashboard displaying stacked bar charts, line graphs and percentage metrics Image

Visual presenting neon analytics dashboard with stacked vertical bars, multicolor line graphs, gridlines and prominent numeric labels including 29% and 20%. High-contrast dark background and glowing tones creating futuristic tech aesthetic and sense of live market activity. Highlighting financial and performance metrics while supporting data-driven storytelling for business and finance audiences. Ideal for fintech landing pages, investor presentations, financial reports, marketing banners, social media campaigns and editorial illustrations about market trends. Use for header graphics, slide decks, UI mockups, dashboard templates or promotional creatives; crop for hero banners or layer with text and logos for branded assets. Featuring crisp vector-like bars and readable numeric overlays, suiting high-resolution printing and digital presentation.
Powered by  - Get 15% off with code: PIKWIZARD15


0
downloads
downloads
Tags:
More
Credit Photo
If you would like to credit the Photo, here are some ways you can do so
Text Link
photo Link
<span class="text-link">
<span>
<a target="_blank" href=https://pikwizard.com/photo/neon-analytics-dashboard-displaying-stacked-bar-charts-line-graphs-and-percentage-metrics/23d2851e1bb1cc2639e21ef2c0c8993c/>PikWizard</a>
</span>
</span>
<span class="image-link">
<span
style="margin: 0 0 20px 0; display: inline-block; vertical-align: middle; width: 100%;"
>
<a
target="_blank"
href="https://pikwizard.com/photo/neon-analytics-dashboard-displaying-stacked-bar-charts-line-graphs-and-percentage-metrics/23d2851e1bb1cc2639e21ef2c0c8993c/"
style="text-decoration: none; font-size: 10px; margin: 0;"
>
<img src="https://pikwizard.com/pw/medium/23d2851e1bb1cc2639e21ef2c0c8993c.jpg" style="margin: 0; width: 100%;" alt="" />
<p style="font-size: 12px; margin: 0;">PikWizard</p>
</a>
</span>
</span>
Free (free of charge)
Free for personal and commercial use.
Author: Awesome Content
Similar Free Stock Images
Premium


Premium

Premium


Premium


Premium


Premium


Premium


Premium


Premium


Premium


Premium