- Home >
- Stock Photos >
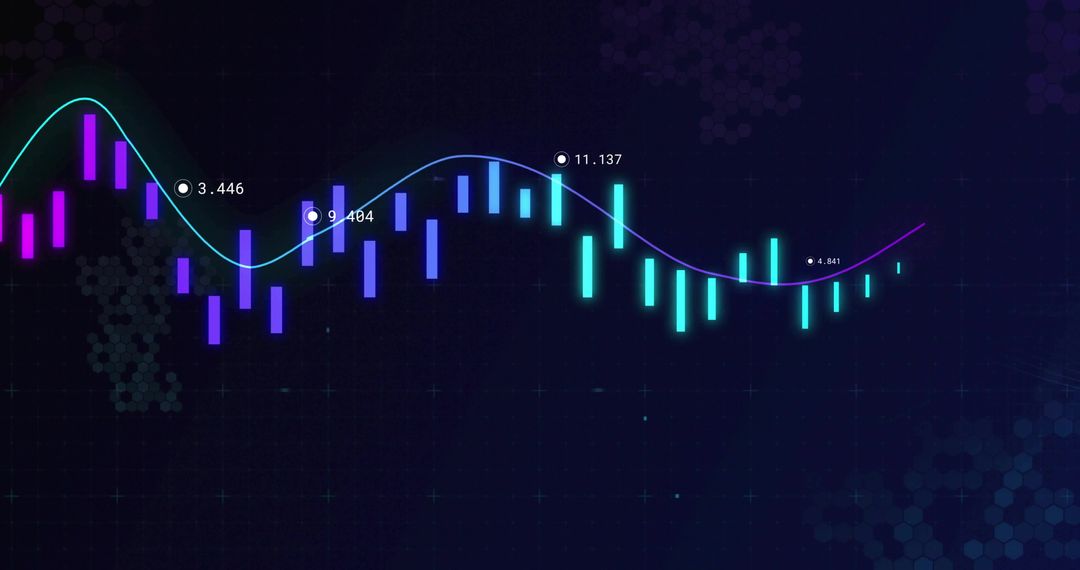
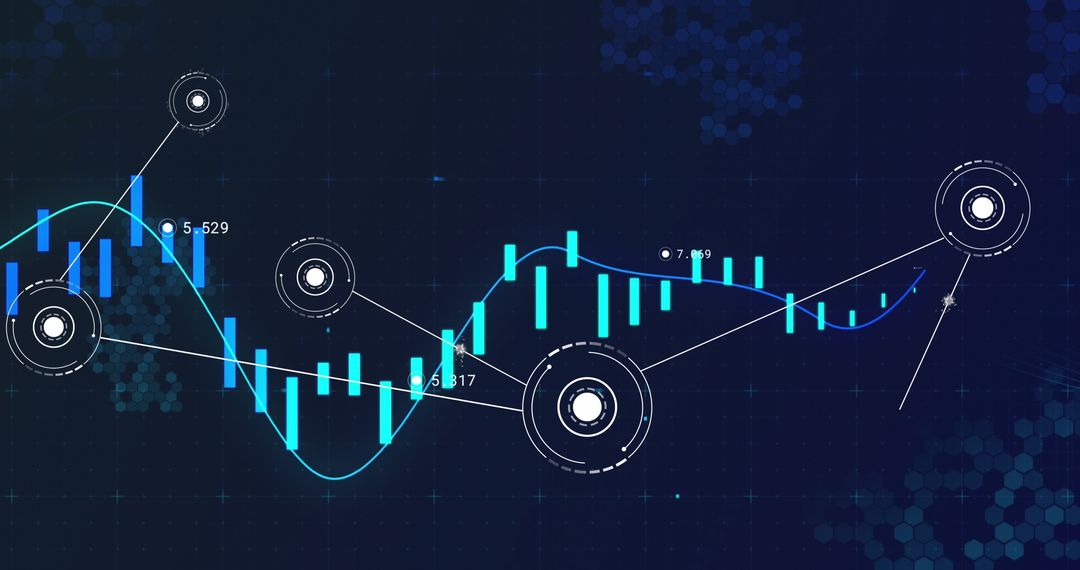
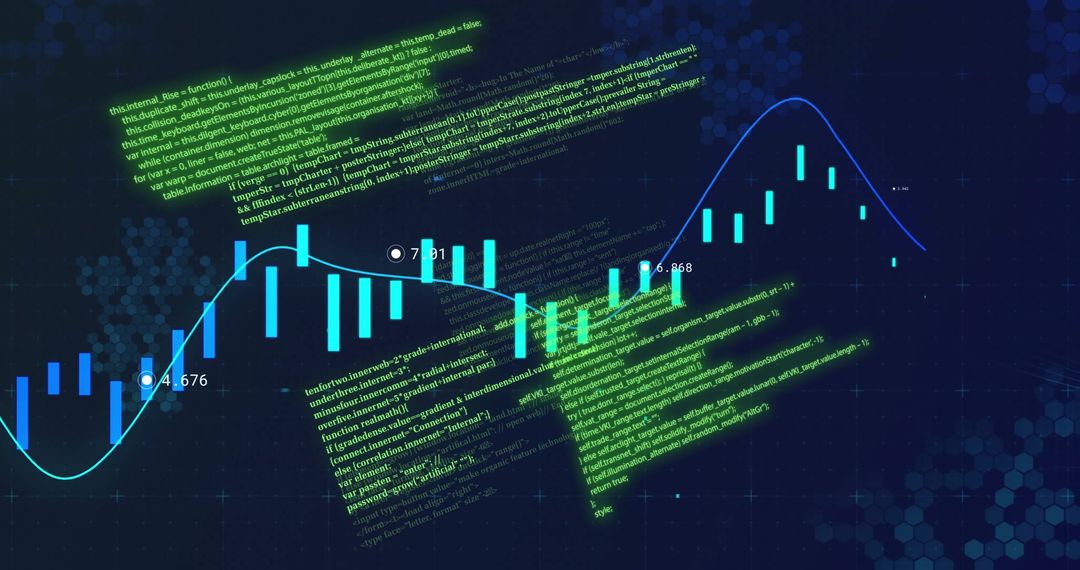
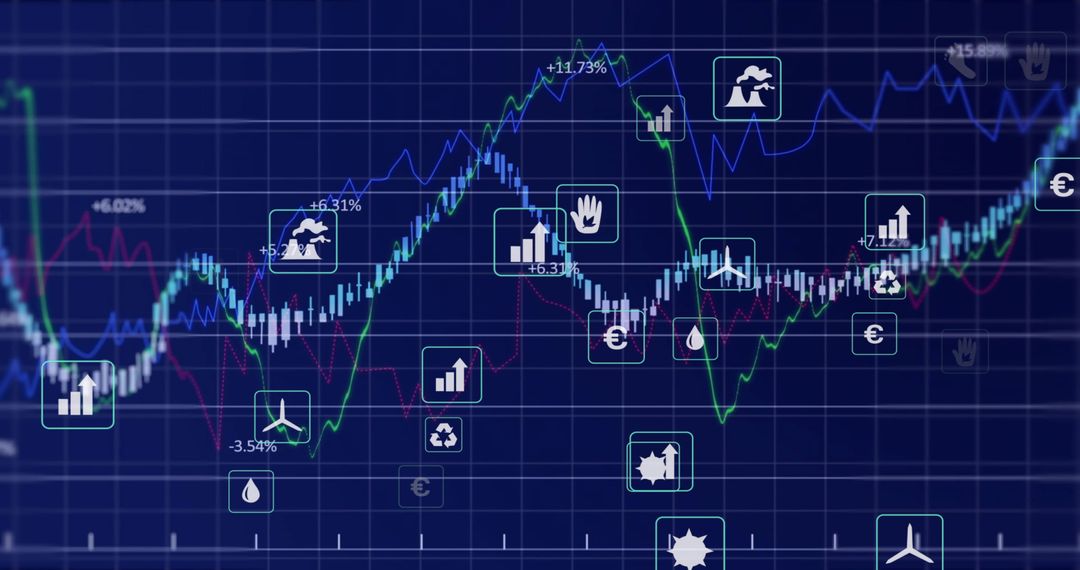
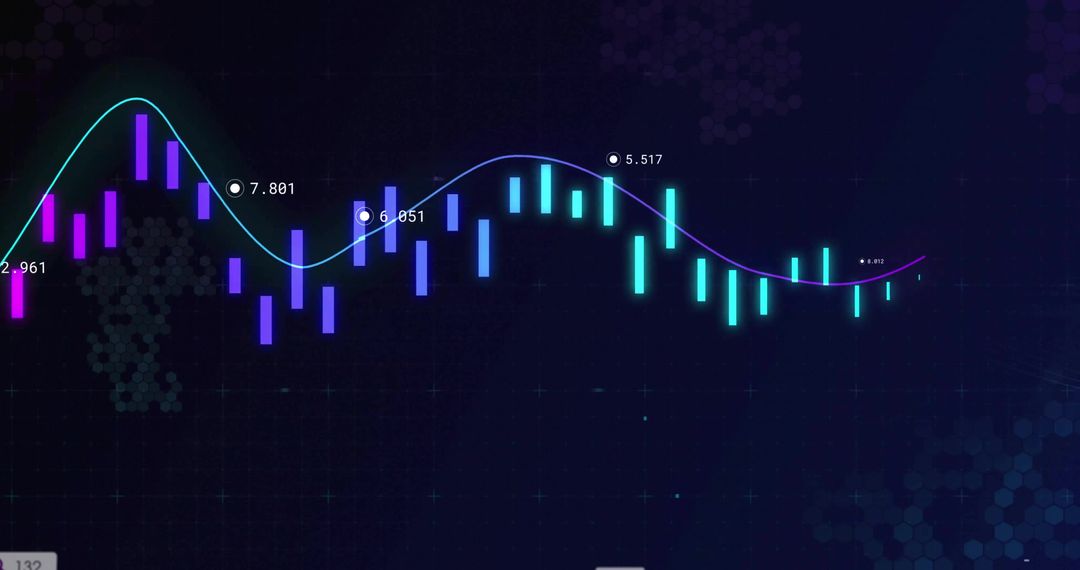
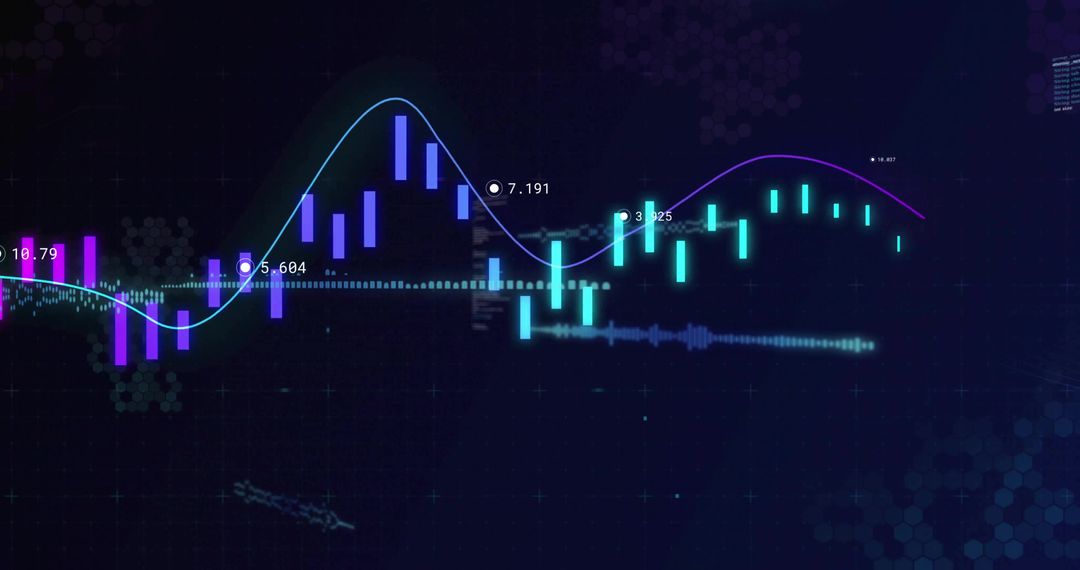
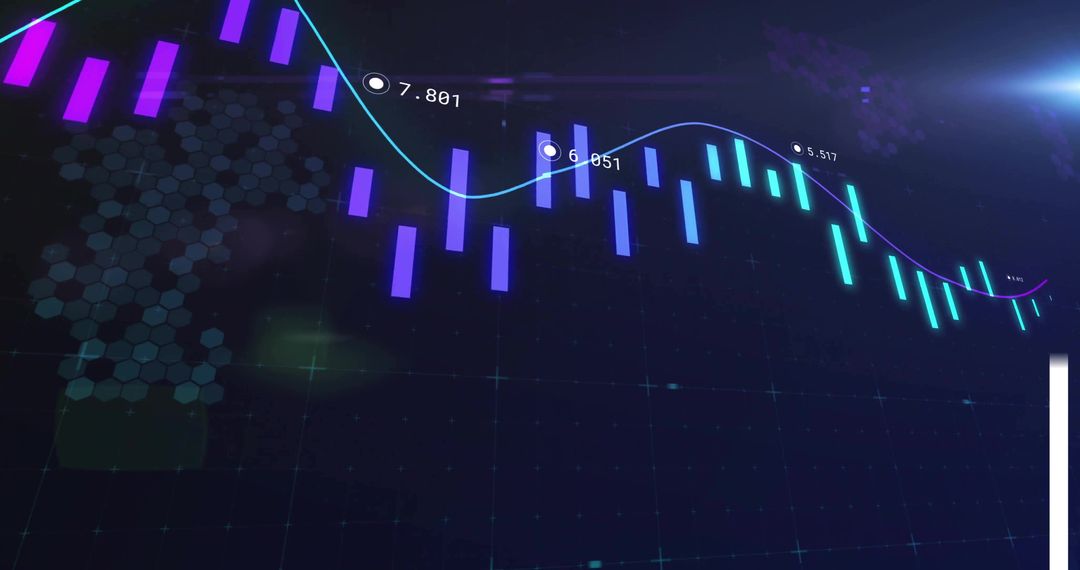
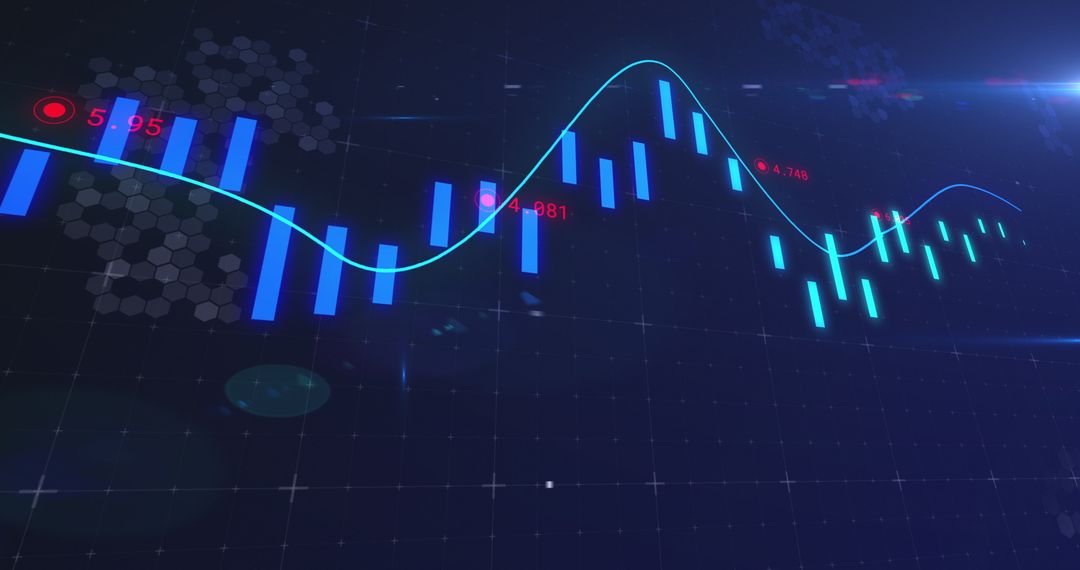
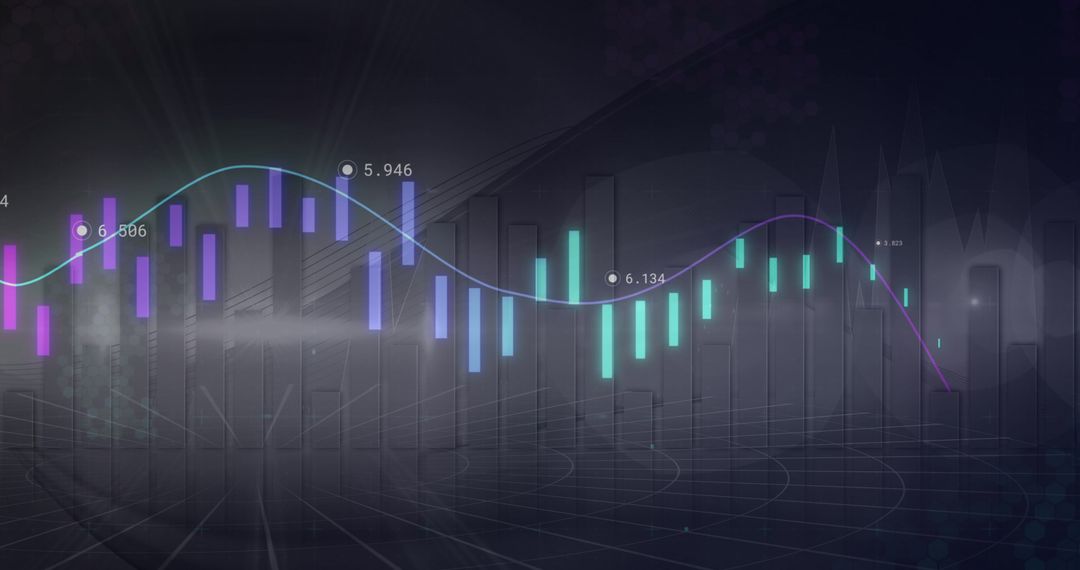
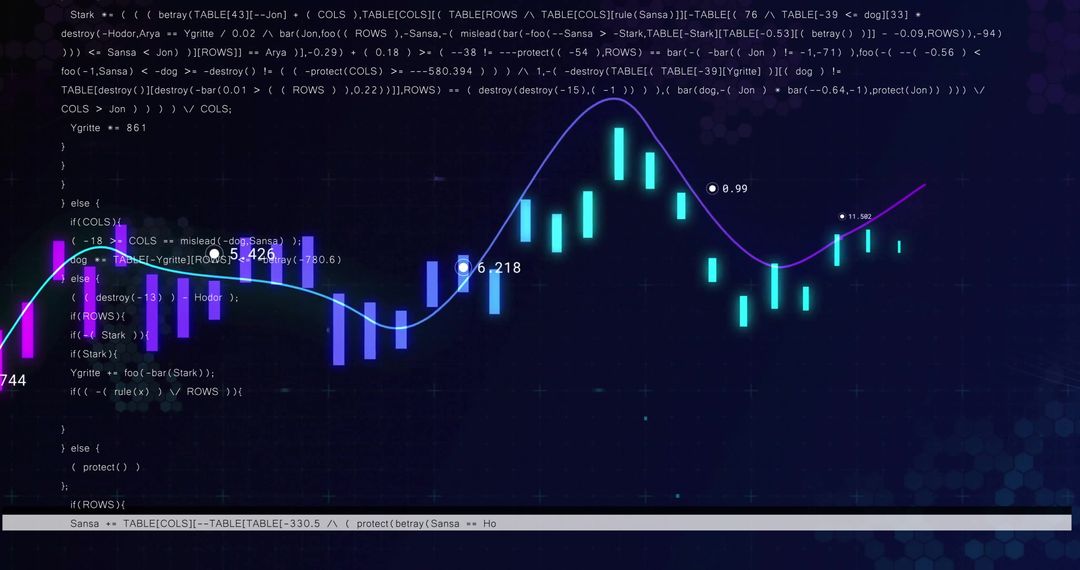
- Neon Candlestick Chart Visualizing Market Trend on Digital Finance Dashboard with Icons
Neon Candlestick Chart Visualizing Market Trend on Digital Finance Dashboard with Icons Image
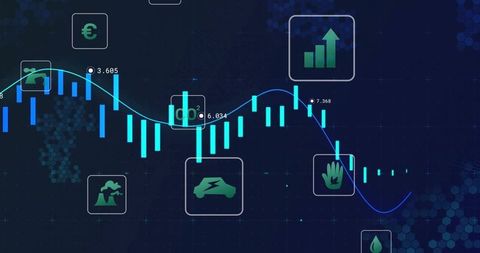
Displaying cyan candlesticks and glowing blue trend line across dark digital dashboard, overlaying icons representing euro, growth, electric vehicle, plant, water drop to suggest finance and sustainability crossover. Serving as data-driven design asset for fintech, investment research, market analysis, ESG reporting. Using as website hero for fintech startups, including in investor presentations to illustrate market movement and sector signals, applying in blog posts about trading strategies and sustainable investing, adding to social media posts for market updates and campaign visuals. Offering high contrast neon palette and clear chart elements for easy annotation and text overlay.
Powered by  - Get 15% off with code: PIKWIZARD15


0
downloads
downloads
Tags:
More
Credit Photo
If you would like to credit the Photo, here are some ways you can do so
Text Link
photo Link
<span class="text-link">
<span>
<a target="_blank" href=https://pikwizard.com/photo/neon-candlestick-chart-visualizing-market-trend-on-digital-finance-dashboard-with-icons/bc9ba3b209c9fef57527fd9a5f6928cc/>PikWizard</a>
</span>
</span>
<span class="image-link">
<span
style="margin: 0 0 20px 0; display: inline-block; vertical-align: middle; width: 100%;"
>
<a
target="_blank"
href="https://pikwizard.com/photo/neon-candlestick-chart-visualizing-market-trend-on-digital-finance-dashboard-with-icons/bc9ba3b209c9fef57527fd9a5f6928cc/"
style="text-decoration: none; font-size: 10px; margin: 0;"
>
<img src="https://pikwizard.com/pw/medium/bc9ba3b209c9fef57527fd9a5f6928cc.jpg" style="margin: 0; width: 100%;" alt="" />
<p style="font-size: 12px; margin: 0;">PikWizard</p>
</a>
</span>
</span>
Free (free of charge)
Free for personal and commercial use.
Author: Authentic Images
Similar Free Stock Images

Premium


Premium


Premium


Premium


Premium


Premium


Premium


Premium


Premium


Premium


Premium


Premium


Premium


Premium


Premium


Premium


Premium


Premium


Premium


Premium


Premium


Premium


Premium


Premium