- Home >
- Stock Photos >
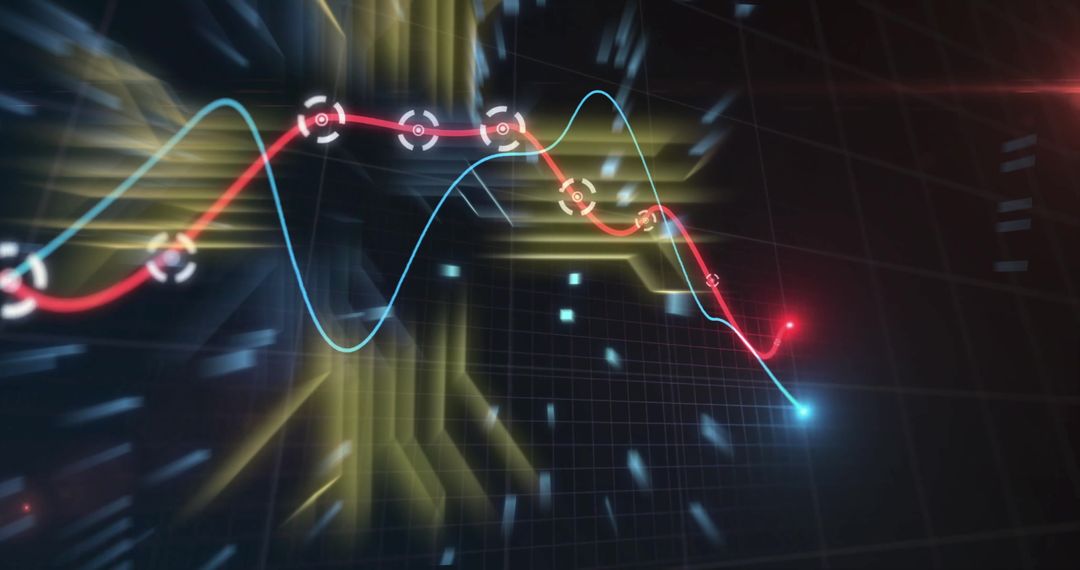
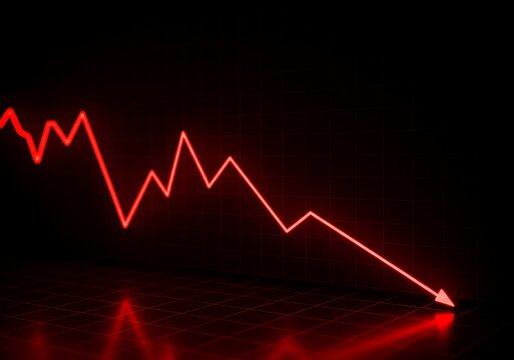
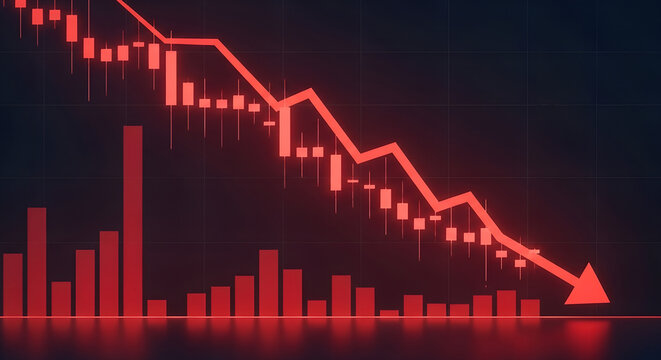
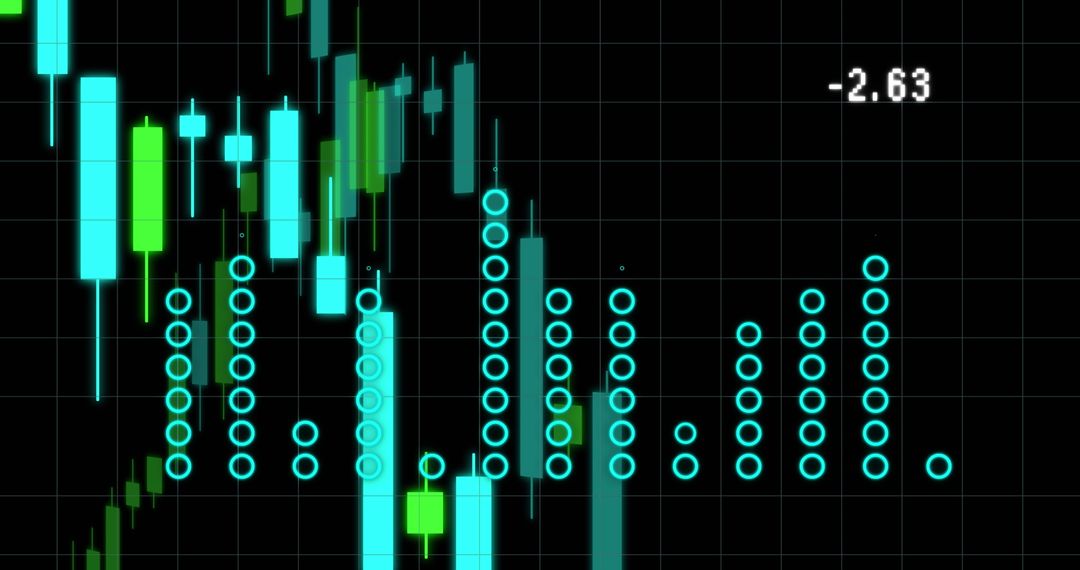
- Neon dotted downward trend on 3D grid showing financial decline and futuristic analytics
Neon dotted downward trend on 3D grid showing financial decline and futuristic analytics Image

Showing neon pink dotted line tracing downward trend across reflective 3D grid with blurred alphanumeric backdrop, conveying market decline and advanced analytics. Featuring glowing nodes, subtle particles, perspective depth and soft blur for futuristic atmosphere. Serving as dynamic visual for financial reports, market analysis blogs, investor presentations, risk management briefs and business news headers. Allowing designers to overlay metrics, headlines, logos and call to action elements; supporting hero banners, infographic backgrounds, social media posts and slide decks. Enabling color adjustment and text integration while maintaining focus on trend line and marker details.
Powered by 


0
downloads
downloads
Tags:
More
Credit Photo
If you would like to credit the Photo, here are some ways you can do so
Text Link
photo Link
<span class="text-link">
<span>
<a target="_blank" href=https://pikwizard.com/photo/neon-dotted-downward-trend-on-3d-grid-showing-financial-decline-and-futuristic-analytics/9d46570ec9e0ed7c9ce9c03c68476edf/>PikWizard</a>
</span>
</span>
<span class="image-link">
<span
style="margin: 0 0 20px 0; display: inline-block; vertical-align: middle; width: 100%;"
>
<a
target="_blank"
href="https://pikwizard.com/photo/neon-dotted-downward-trend-on-3d-grid-showing-financial-decline-and-futuristic-analytics/9d46570ec9e0ed7c9ce9c03c68476edf/"
style="text-decoration: none; font-size: 10px; margin: 0;"
>
<img src="https://pikwizard.com/pw/medium/9d46570ec9e0ed7c9ce9c03c68476edf.jpg" style="margin: 0; width: 100%;" alt="" />
<p style="font-size: 12px; margin: 0;">PikWizard</p>
</a>
</span>
</span>
Free (free of charge)
Free for personal and commercial use.
Author: People Creations
Similar Free Stock Images

Premium


Premium


Premium


Premium


Premium


Premium


Premium


Premium


Premium


Premium


Premium


Premium


Premium


Premium


Premium


Premium


Premium


Premium


Premium


Premium


Premium


Premium


Premium


Premium