
- Home >
- Stock Photos >
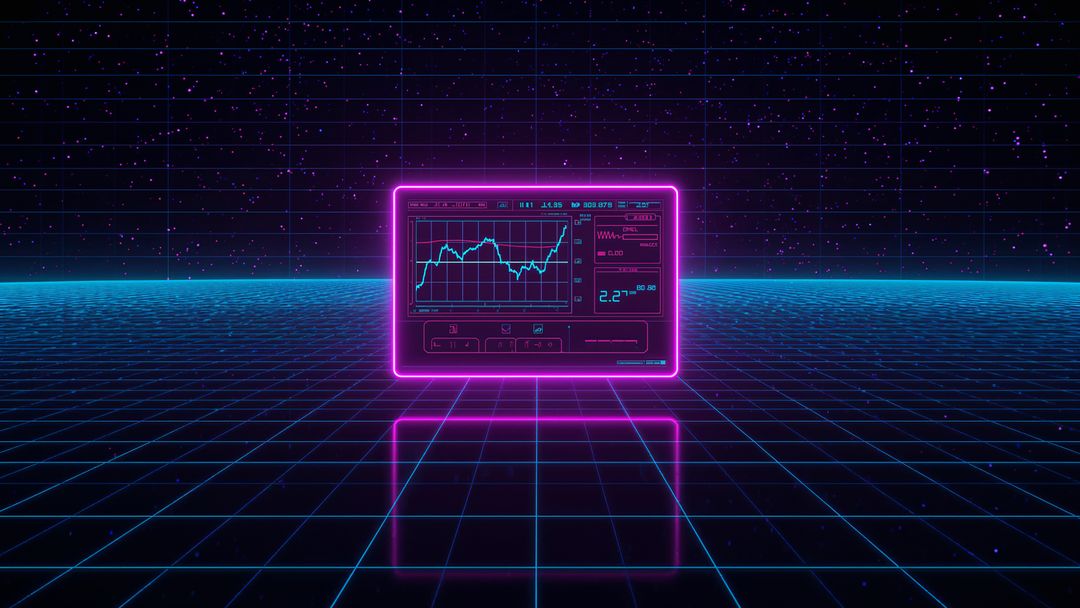
- Neon Energy Market Analytics Dashboard Showing Volatile Resource Trend Lines
Neon Energy Market Analytics Dashboard Showing Volatile Resource Trend Lines Image

Neon teal-cyan line graph on deep purple grid showing jagged market fluctuations with green baseline and floating icons representing recycling, plug, wind turbine, power button, dollar, nuclear, home energy. Graphic working well for energy sector reports, renewable investment presentations, financial volatility analysis, sustainability dashboards, technology pitch decks, website hero banners. Composition featuring high-contrast neon palette and grid layout creating futuristic data display. Layout providing clear focal point and space for headline or logo overlay for easy customization. Great for slide decks, annual reports, press releases, blog headers, social media posts, advertising, editorial illustrations. Color palette supporting dark-mode themes and modern tech branding. File suitable for designers needing striking visual for data-driven storytelling.
Powered by  - Get 15% off with code: PIKWIZARD15


0
downloads
downloads
Tags:
More
Credit Photo
If you would like to credit the Photo, here are some ways you can do so
Text Link
photo Link
<span class="text-link">
<span>
<a target="_blank" href=https://pikwizard.com/photo/neon-energy-market-analytics-dashboard-showing-volatile-resource-trend-lines/9a68dc221d854aea279233ffc64b1fd8/>PikWizard</a>
</span>
</span>
<span class="image-link">
<span
style="margin: 0 0 20px 0; display: inline-block; vertical-align: middle; width: 100%;"
>
<a
target="_blank"
href="https://pikwizard.com/photo/neon-energy-market-analytics-dashboard-showing-volatile-resource-trend-lines/9a68dc221d854aea279233ffc64b1fd8/"
style="text-decoration: none; font-size: 10px; margin: 0;"
>
<img src="https://pikwizard.com/pw/medium/9a68dc221d854aea279233ffc64b1fd8.jpg" style="margin: 0; width: 100%;" alt="" />
<p style="font-size: 12px; margin: 0;">PikWizard</p>
</a>
</span>
</span>
Free (free of charge)
Free for personal and commercial use.
Author: Awesome Content
Similar Free Stock Images

Premium


Premium


Premium


Premium


Premium


Premium


Premium


Premium


Premium


Premium


Premium


Premium


Premium


Premium


Premium


Premium


Premium


Premium


Premium


Premium


Premium


Premium


Premium


Premium

