- Home >
- Stock Photos >
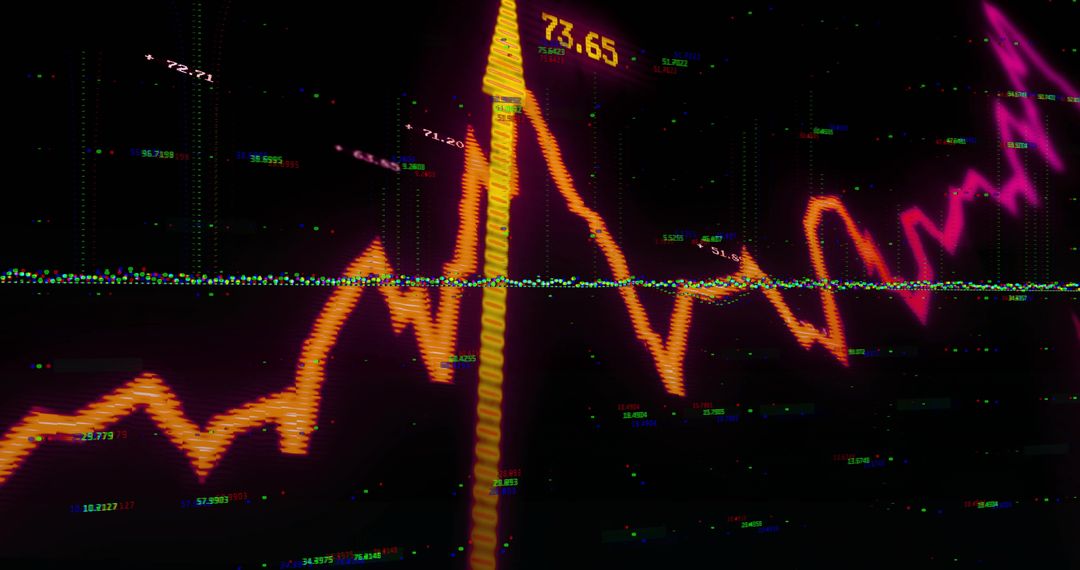
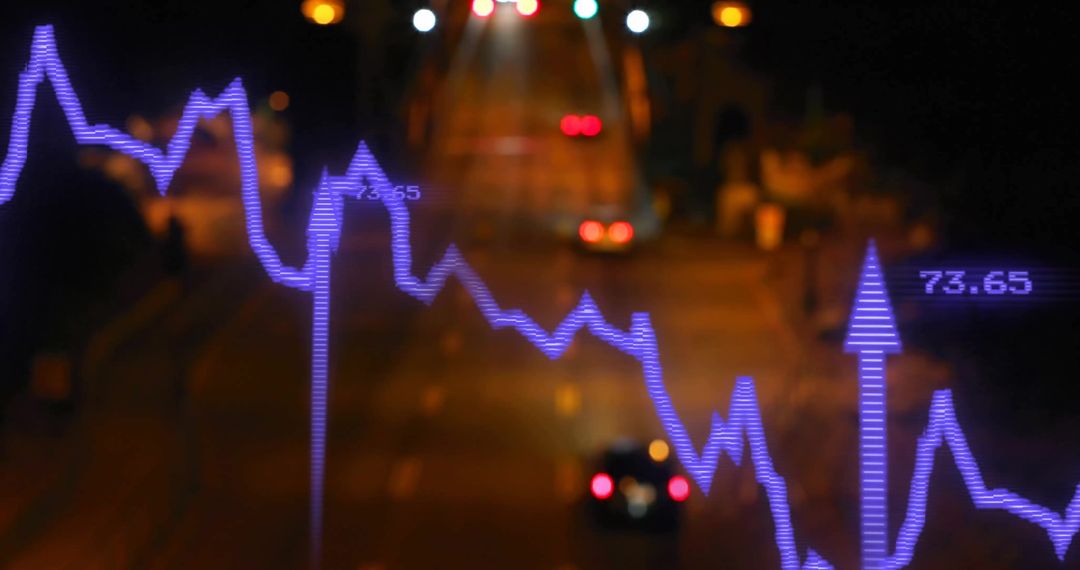
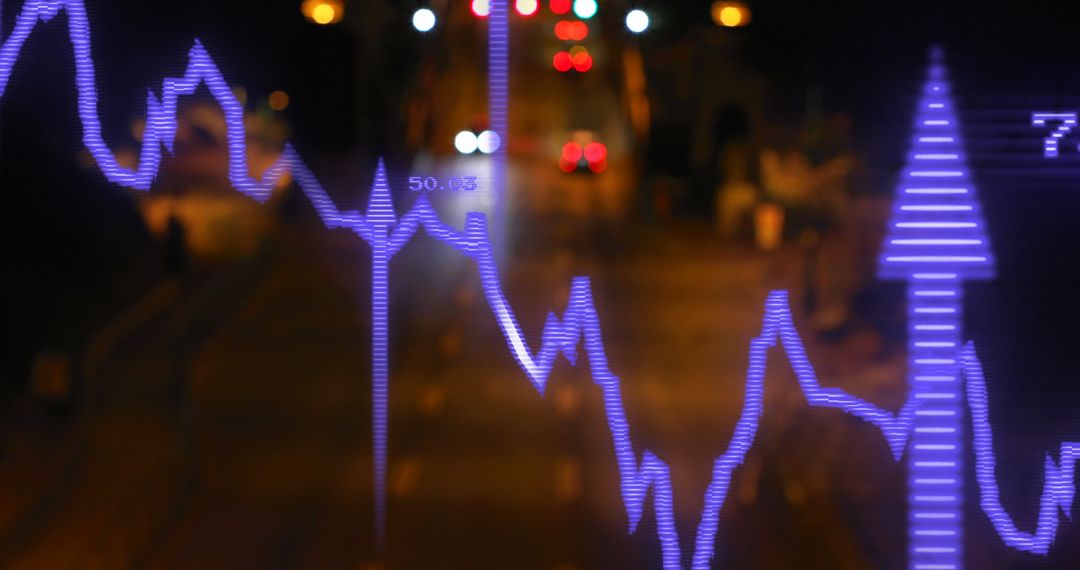
- Neon Financial Chart Showing Jagged Orange Line and Yellow Marker Highlighting 73.65
Neon Financial Chart Showing Jagged Orange Line and Yellow Marker Highlighting 73.65 Image

High-contrast neon graphic showing jagged orange line with yellow marker highlighting 73.65 on deep black background. Suitable for finance websites, trading platforms, fintech app UI, business reports, market analysis videos, presentation slides, article headers, social media posts. Use as hero banner, background for slide deck, animated intro, or thumbnail for market update videos. Crop wide for website headers or video banners; crop square for social tiles; crop vertical for mobile ads. Overlay bold sans-serif headline in white or neon yellow for contrast. Apply subtle glow or motion animation for video production. Color palette supporting neon orange, magenta, yellow against deep black for futuristic, energetic, volatile mood. Editable in design software, easy to combine with data overlays, brand logo, call-to-action buttons. Ideal for illustrating market volatility, price surge, peak value, trading signals, data analytics, investment insights.
Powered by  - Get 15% off with code: PIKWIZARD15


0
downloads
downloads
Tags:
More
Credit Photo
If you would like to credit the Photo, here are some ways you can do so
Text Link
photo Link
<span class="text-link">
<span>
<a target="_blank" href=https://pikwizard.com/photo/neon-financial-chart-showing-jagged-orange-line-and-yellow-marker-highlighting-73-65/feec94b3e820727b7913a4d09cc29ad7/>PikWizard</a>
</span>
</span>
<span class="image-link">
<span
style="margin: 0 0 20px 0; display: inline-block; vertical-align: middle; width: 100%;"
>
<a
target="_blank"
href="https://pikwizard.com/photo/neon-financial-chart-showing-jagged-orange-line-and-yellow-marker-highlighting-73-65/feec94b3e820727b7913a4d09cc29ad7/"
style="text-decoration: none; font-size: 10px; margin: 0;"
>
<img src="https://pikwizard.com/pw/medium/feec94b3e820727b7913a4d09cc29ad7.jpg" style="margin: 0; width: 100%;" alt="" />
<p style="font-size: 12px; margin: 0;">PikWizard</p>
</a>
</span>
</span>
Free (free of charge)
Free for personal and commercial use.
Author: Authentic Images
Similar Free Stock Images
Premium


Premium


Premium


Premium


Premium


Premium


Premium


Premium


Premium


Premium


Premium


Premium


Premium


Premium


Premium


Premium


Premium


Premium


Premium


Premium


Premium


Premium


Premium


Premium