
- Home >
- Stock Photos >
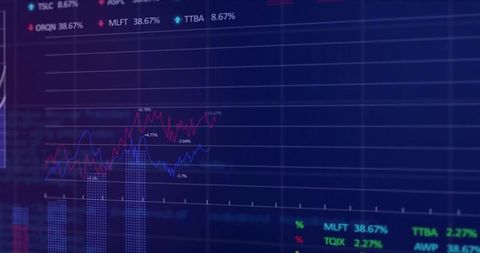
- Neon Financial Dashboard Displaying Market Charts and 38.67% Marker on Tilted Grid Monitor
Neon Financial Dashboard Displaying Market Charts and 38.67% Marker on Tilted Grid Monitor Image

Displaying neon financial dashboard with layered line charts, bar graphs, glowing percentage marker 38.67% and floating tooltips on tilted grid monitor. Conveying market volatility, trading activity, investment performance, real-time analytics. Serving fintech websites, trading platform landing pages, financial presentations, blog posts about market trends, marketing materials. Suggesting cropping for hero banner, desktop background, slide deck; applying color overlay or blur to foreground for headline text. Providing high-energy futuristic look for content about data-driven finance, algorithmic trading, stock market education.
Powered by  - Get 15% off with code: PIKWIZARD15


0
downloads
downloads
Tags:
More
Credit Photo
If you would like to credit the Photo, here are some ways you can do so
Text Link
photo Link
<span class="text-link">
<span>
<a target="_blank" href=https://pikwizard.com/photo/neon-financial-dashboard-displaying-market-charts-and-38-67-percent-marker-on-tilted-grid-monitor/2111ebbe4567dad5d77877682b182118/>PikWizard</a>
</span>
</span>
<span class="image-link">
<span
style="margin: 0 0 20px 0; display: inline-block; vertical-align: middle; width: 100%;"
>
<a
target="_blank"
href="https://pikwizard.com/photo/neon-financial-dashboard-displaying-market-charts-and-38-67-percent-marker-on-tilted-grid-monitor/2111ebbe4567dad5d77877682b182118/"
style="text-decoration: none; font-size: 10px; margin: 0;"
>
<img src="https://pikwizard.com/pw/medium/2111ebbe4567dad5d77877682b182118.jpg" style="margin: 0; width: 100%;" alt="" />
<p style="font-size: 12px; margin: 0;">PikWizard</p>
</a>
</span>
</span>
Free (free of charge)
Free for personal and commercial use.
Author: Creative Art
Similar Free Stock Images

Premium


Premium


Premium


Premium


Premium


Premium


Premium


Premium


Premium


Premium


Premium


Premium


Premium


Premium


Premium


Premium


Premium


Premium


Premium


Premium


Premium


Premium


Premium


Premium


Premium

