- Home >
- Stock Photos >
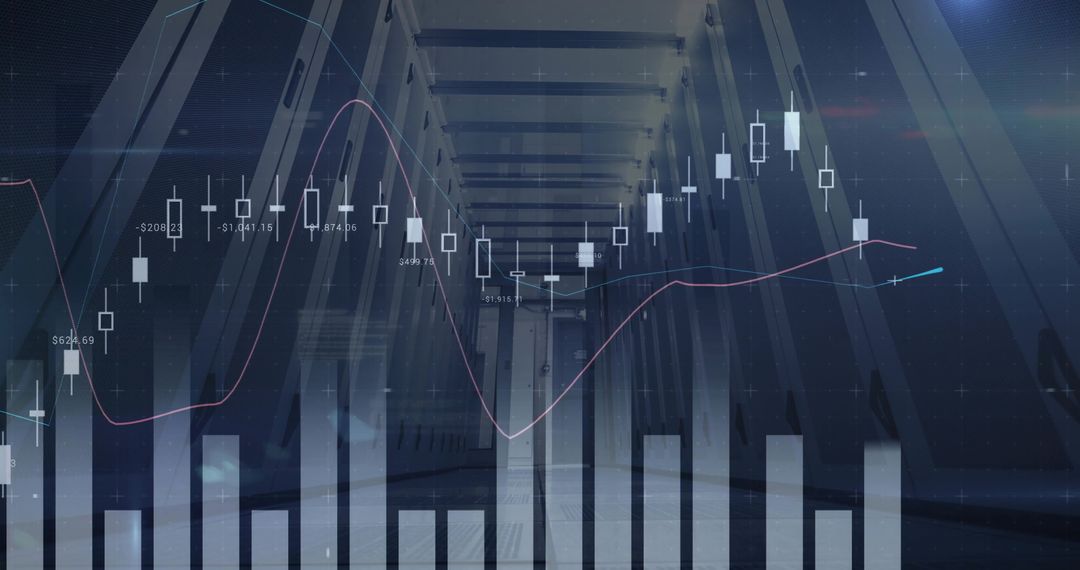
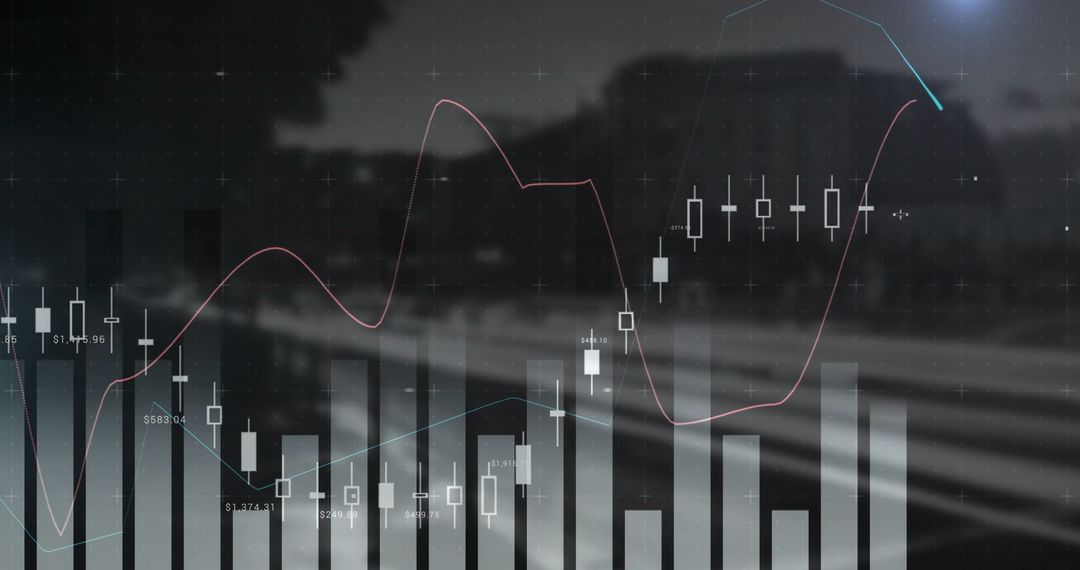
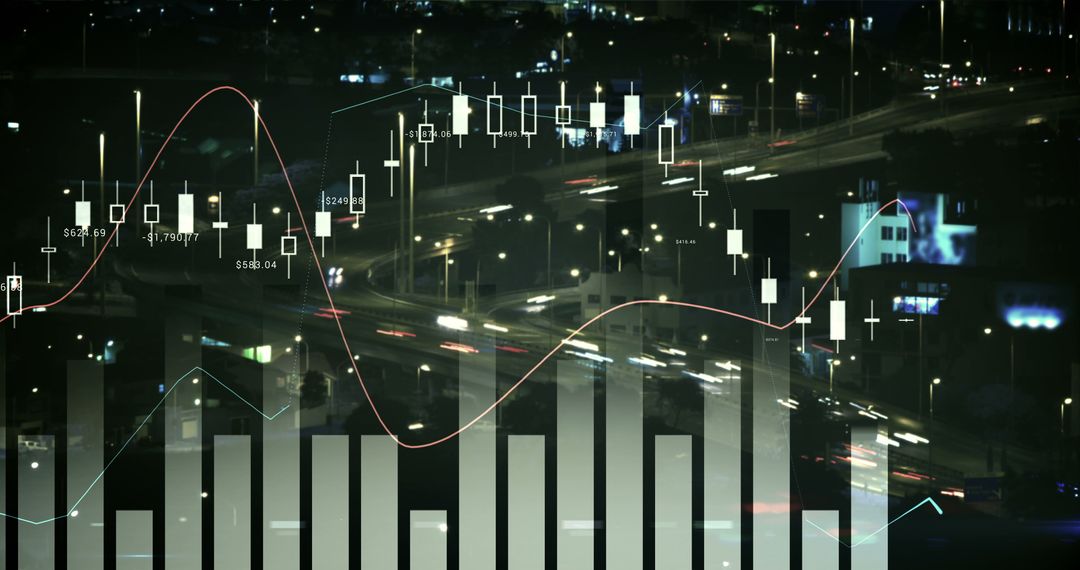
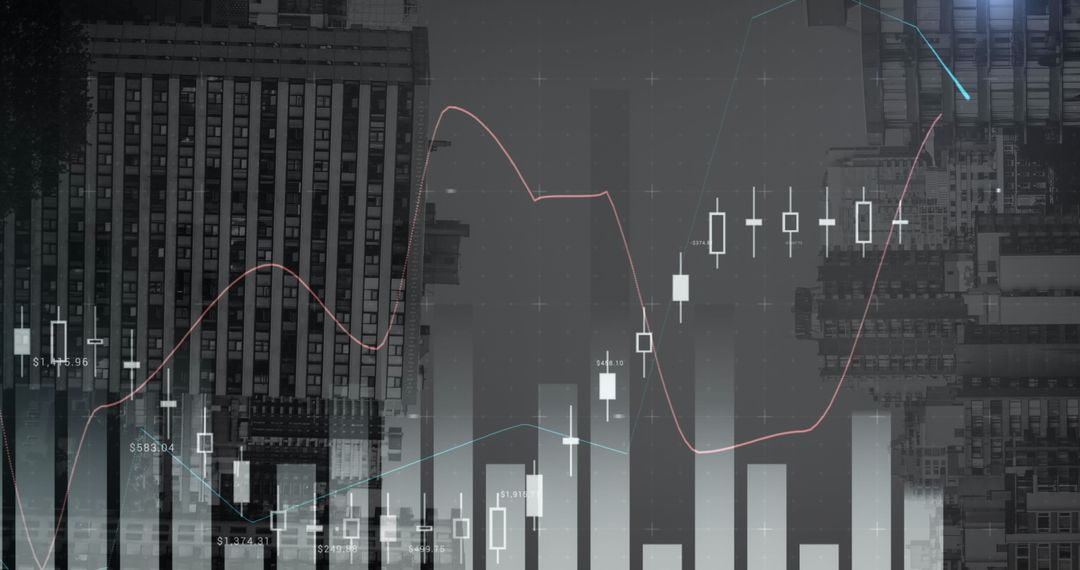
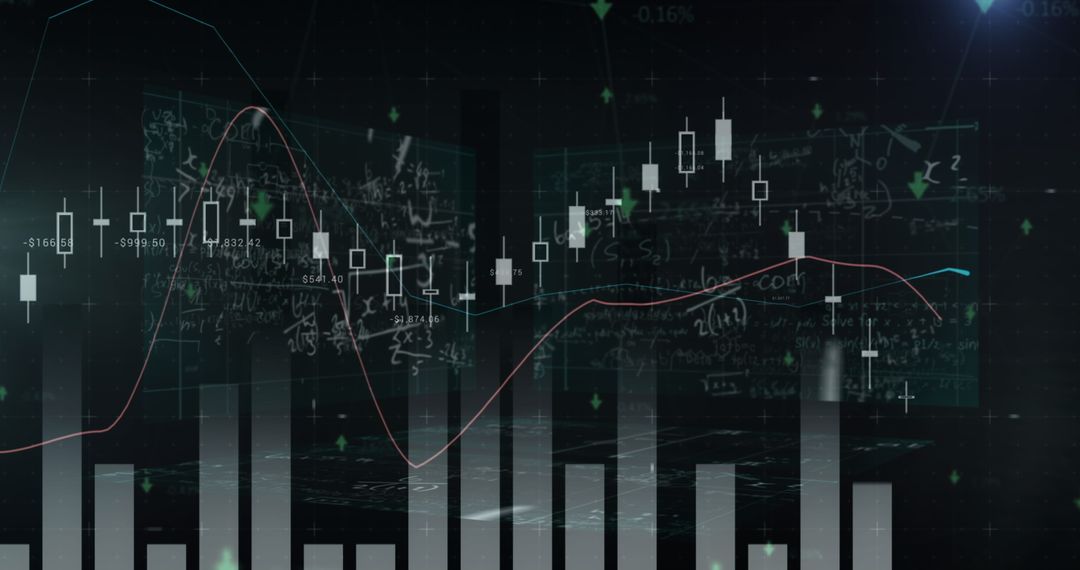
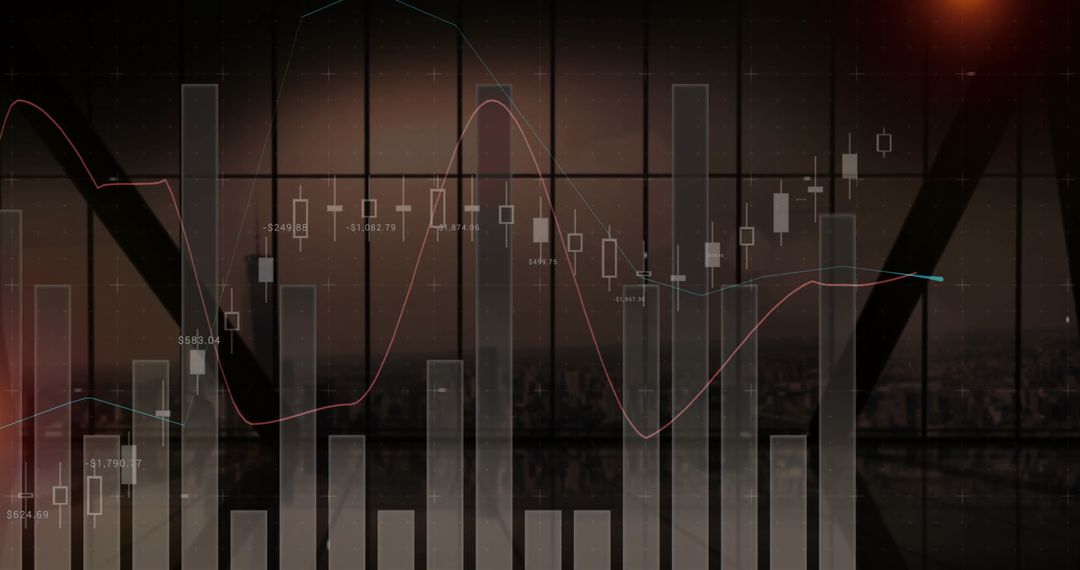
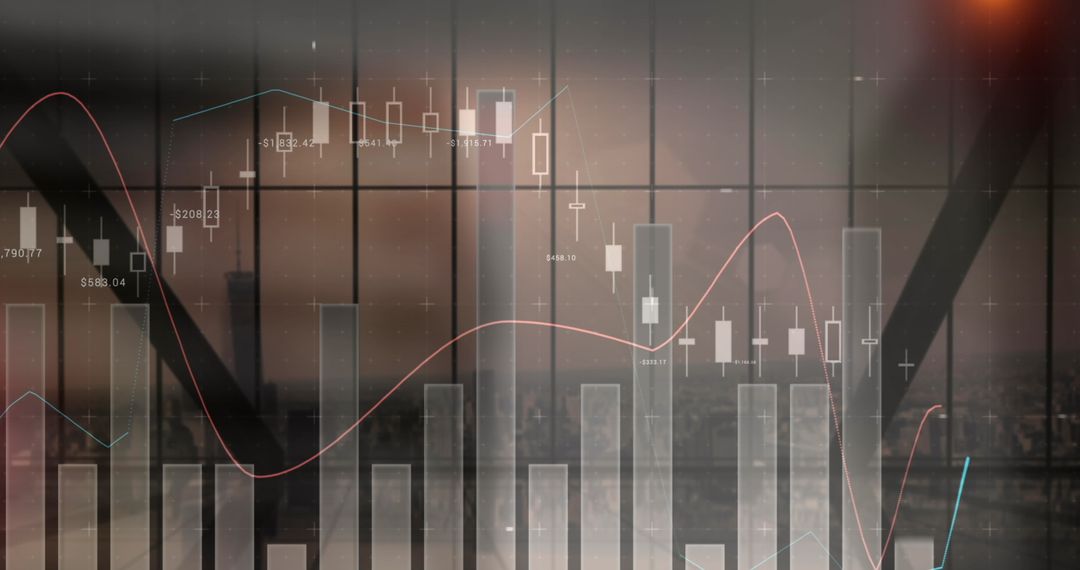
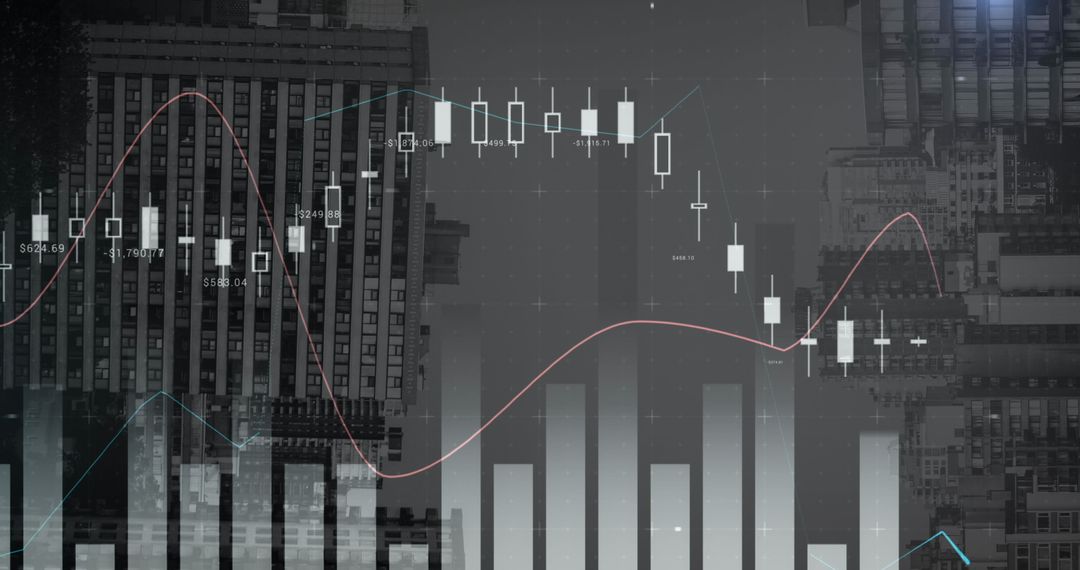
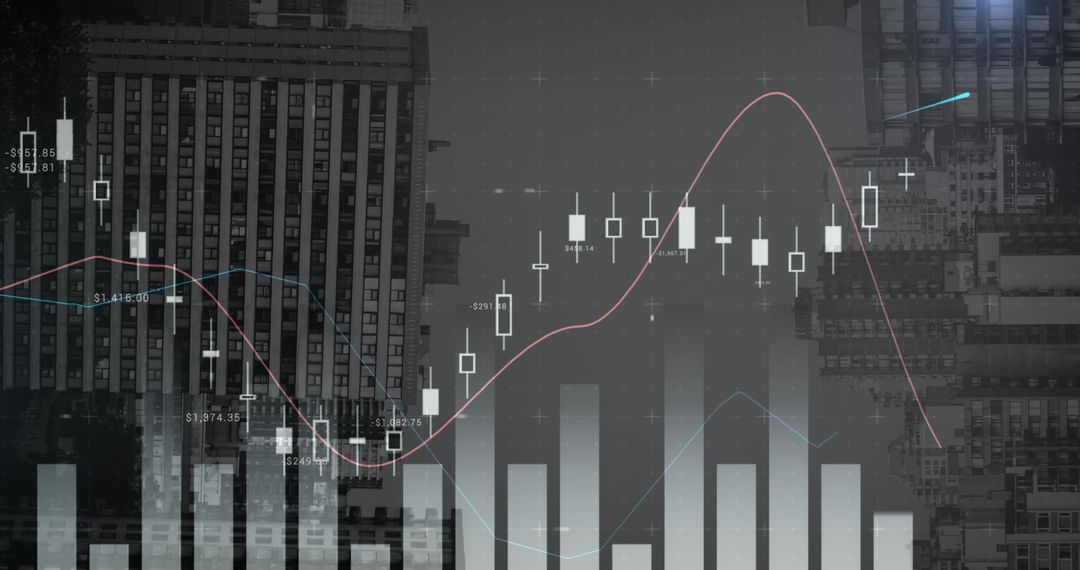
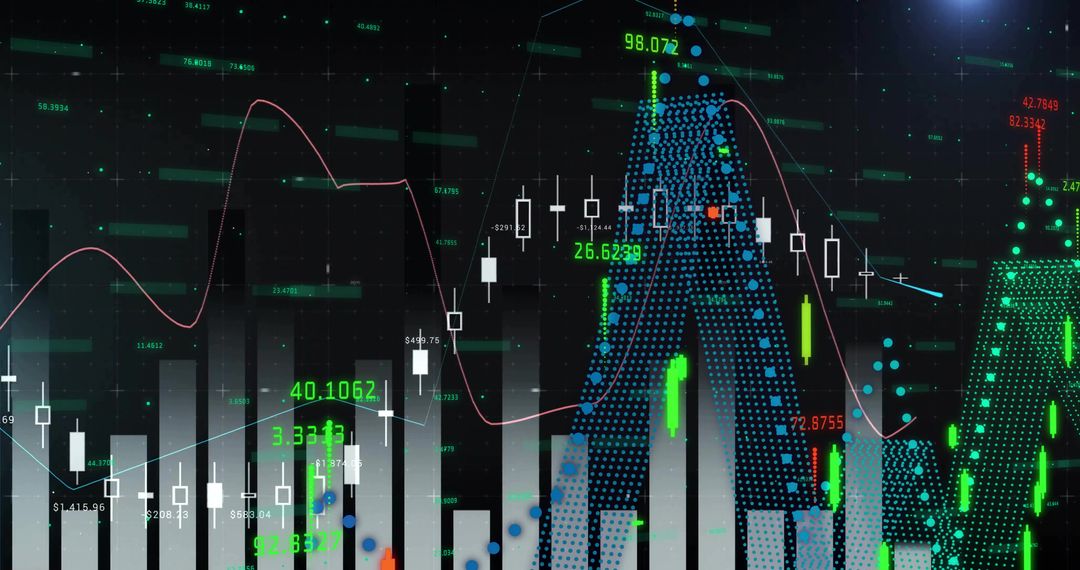
- Neon Financial Dashboard Over City Skyline Showing Candlestick Charts and Growth Analytics
Neon Financial Dashboard Over City Skyline Showing Candlestick Charts and Growth Analytics Image

Stylized neon financial dashboard showing candlestick charts, bar graphs, trend lines, and icon panels layered over night city skyline. Dark blue and purple palette featuring glowing light band across horizon and translucent UI tiles highlighting currency symbols, upward growth icon, and sustainability motifs. Composition combining data visualization with urban architecture to create futuristic finance vibe. Serving fintech landing pages, investment reports, trading platform marketing, business presentations, social media headers, blog banners, slide deck backgrounds, conference signage, and app UI mockups. Suggestions for use: apply overlay text or logo, animate trend lines for web hero, crop for wide banner, pair with data callouts for investor decks, or use as backdrop for financial article or product launch.
Powered by  - Get 15% off with code: PIKWIZARD15


0
downloads
downloads
Tags:
More
Credit Photo
If you would like to credit the Photo, here are some ways you can do so
Text Link
photo Link
<span class="text-link">
<span>
<a target="_blank" href=https://pikwizard.com/photo/neon-financial-dashboard-over-city-skyline-showing-candlestick-charts-and-growth-analytics/e87d473f0402e0f00fc9233b13359eaf/>PikWizard</a>
</span>
</span>
<span class="image-link">
<span
style="margin: 0 0 20px 0; display: inline-block; vertical-align: middle; width: 100%;"
>
<a
target="_blank"
href="https://pikwizard.com/photo/neon-financial-dashboard-over-city-skyline-showing-candlestick-charts-and-growth-analytics/e87d473f0402e0f00fc9233b13359eaf/"
style="text-decoration: none; font-size: 10px; margin: 0;"
>
<img src="https://pikwizard.com/pw/medium/e87d473f0402e0f00fc9233b13359eaf.jpg" style="margin: 0; width: 100%;" alt="" />
<p style="font-size: 12px; margin: 0;">PikWizard</p>
</a>
</span>
</span>
Free (free of charge)
Free for personal and commercial use.
Author: Authentic Images
Similar Free Stock Images

Premium


Premium


Premium


Premium


Premium


Premium


Premium


Premium


Premium


Premium


Premium


Premium


Premium


Premium


Premium


Premium


Premium


Premium


Premium


Premium


Premium


Premium


Premium


Premium