- Home >
- Stock Photos >
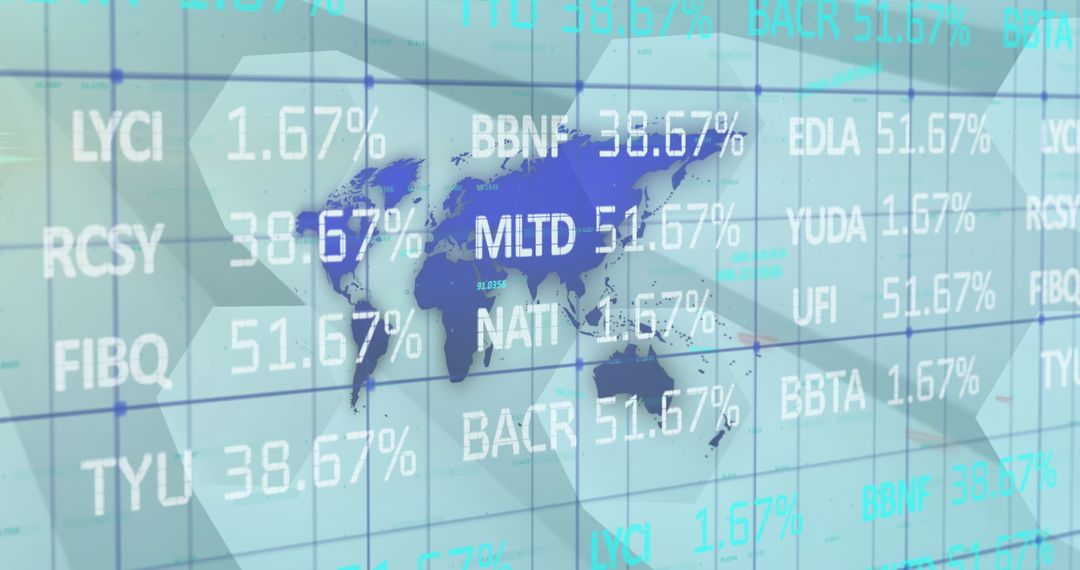
- Neon financial dashboard showing global market data, stock tickers, line charts, pie chart
Neon financial dashboard showing global market data, stock tickers, line charts, pie chart Image

Colorful neon dashboard displaying live market data with overlapping line charts, scrolling stock tickers, pie chart, and stylized globe. Blue-green glow and grid overlays creating futuristic fintech look suitable for corporate presentations, website hero banners, and conference backdrops. Working well for financial reports, investor pitch decks, trading platform demos, blog headers about stocks or cryptocurrency, and marketing materials for fintech startups. High-contrast UI elements supporting overlaying text and icons while maintaining clear focal points for CTAs and data callouts. Usage suggestions: pairing with bold headline, applying brand color accents, cropping for header use or background fill, animating charts for video intros and social media ads.
Powered by 


0
downloads
downloads
Tags:
More
Credit Photo
If you would like to credit the Photo, here are some ways you can do so
Text Link
photo Link
<span class="text-link">
<span>
<a target="_blank" href=https://pikwizard.com/photo/neon-financial-dashboard-showing-global-market-data-stock-tickers-line-charts-pie-chart/455e5ace1775b914b3c2cd047dd057b7/>PikWizard</a>
</span>
</span>
<span class="image-link">
<span
style="margin: 0 0 20px 0; display: inline-block; vertical-align: middle; width: 100%;"
>
<a
target="_blank"
href="https://pikwizard.com/photo/neon-financial-dashboard-showing-global-market-data-stock-tickers-line-charts-pie-chart/455e5ace1775b914b3c2cd047dd057b7/"
style="text-decoration: none; font-size: 10px; margin: 0;"
>
<img src="https://pikwizard.com/pw/medium/455e5ace1775b914b3c2cd047dd057b7.jpg" style="margin: 0; width: 100%;" alt="" />
<p style="font-size: 12px; margin: 0;">PikWizard</p>
</a>
</span>
</span>
Free (free of charge)
Free for personal and commercial use.
Author: Creative Art
Similar Free Stock Images
Premium


Premium


Premium


Premium


Premium


Premium


Premium


Premium


Premium


Premium


Premium


Premium


Premium


Premium


Premium


Premium


Premium


Premium


Premium


Premium


Premium


Premium


Premium


Premium