- Home >
- Stock Photos >
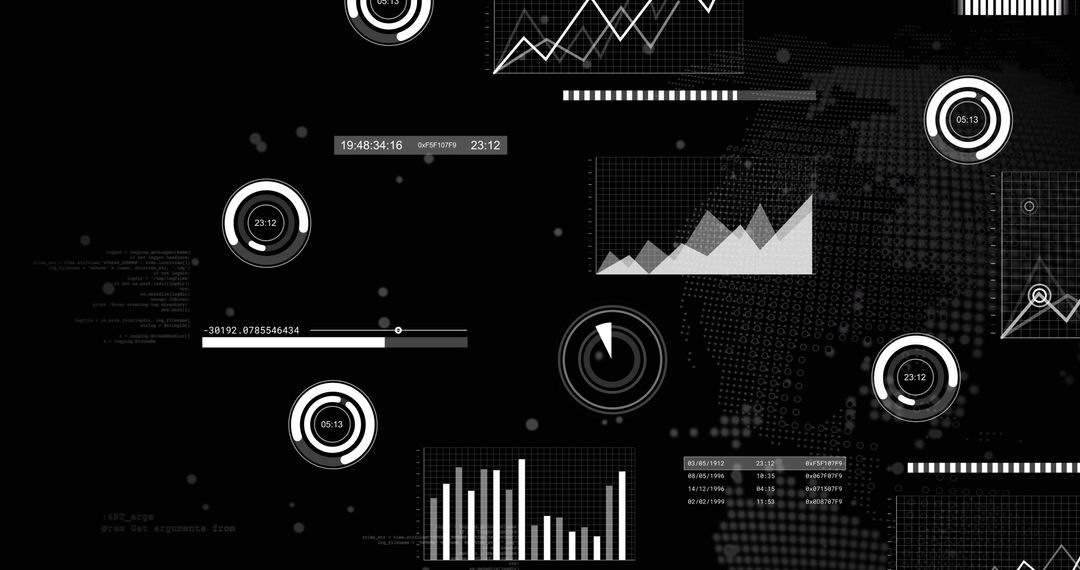
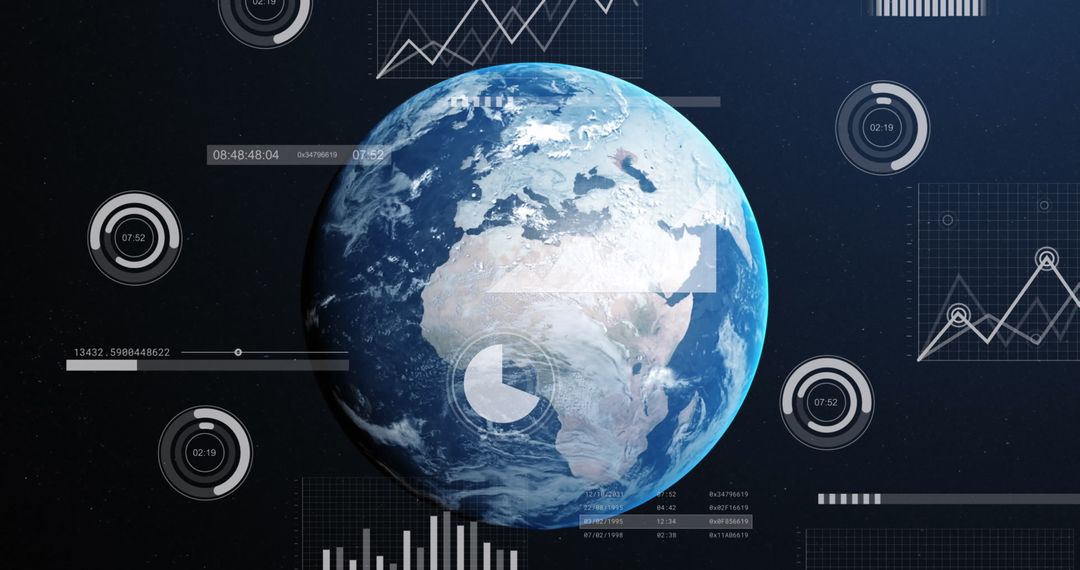
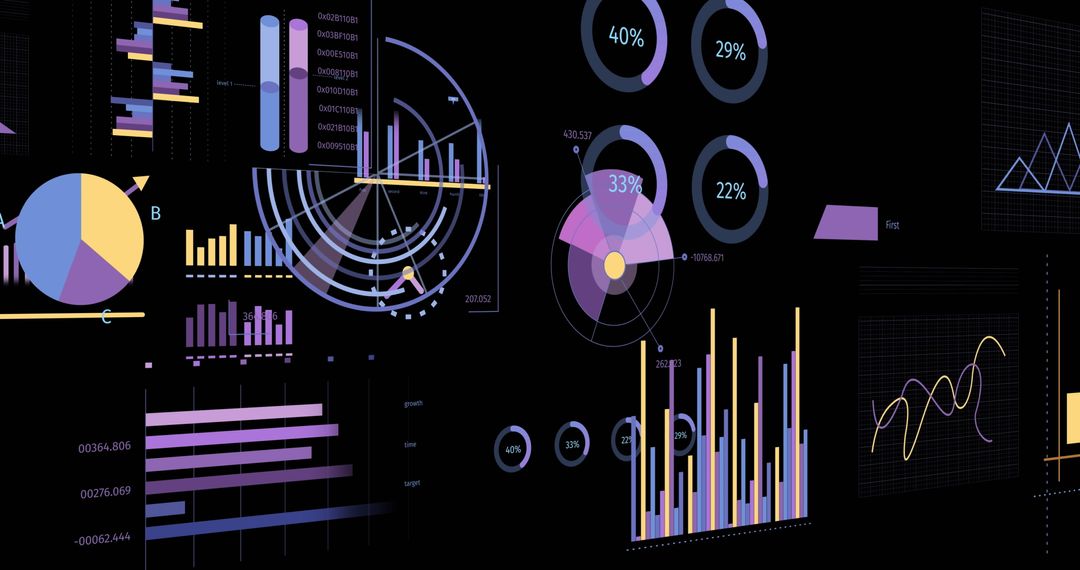
- Neon holographic data dashboard with multicolor torus highlighting bar chart and gauges
Neon holographic data dashboard with multicolor torus highlighting bar chart and gauges Image

Composition showing neon multicolor torus encircling vertical bar chart on deep navy dashboard, with multiple circular gauges, line charts and grid overlays. Visual language combining holographic glow, gradient lighting and HUD elements, conveying futuristic analytics, big data and real-time monitoring. Use for technology presentations, data science and fintech websites, app UI mockups, corporate reports, marketing banners, blog headers and social media adverts. Working well as hero background for slide decks, pitch materials and explainer videos, or serving as illustration for articles about analytics, artificial intelligence, machine learning and dashboard design. High contrast and vivid neon palette supporting overlaying text and icons while maintaining legibility across digital and print formats.
Powered by  - Get 15% off with code: PIKWIZARD15


0
downloads
downloads
Tags:
More
Credit Photo
If you would like to credit the Photo, here are some ways you can do so
Text Link
photo Link
<span class="text-link">
<span>
<a target="_blank" href=https://pikwizard.com/photo/neon-holographic-data-dashboard-with-multicolor-torus-highlighting-bar-chart-and-gauges/ee203e17a9caabe683e8d84791f367c0/>PikWizard</a>
</span>
</span>
<span class="image-link">
<span
style="margin: 0 0 20px 0; display: inline-block; vertical-align: middle; width: 100%;"
>
<a
target="_blank"
href="https://pikwizard.com/photo/neon-holographic-data-dashboard-with-multicolor-torus-highlighting-bar-chart-and-gauges/ee203e17a9caabe683e8d84791f367c0/"
style="text-decoration: none; font-size: 10px; margin: 0;"
>
<img src="https://pikwizard.com/pw/medium/ee203e17a9caabe683e8d84791f367c0.jpg" style="margin: 0; width: 100%;" alt="" />
<p style="font-size: 12px; margin: 0;">PikWizard</p>
</a>
</span>
</span>
Free (free of charge)
Free for personal and commercial use.
Author: People Creations
Similar Free Stock Images

Premium


Premium


Premium


Premium


Premium


Premium


Premium


Premium


Premium


Premium


Premium


Premium


Premium


Premium


Premium


Premium


Premium


Premium


Premium


Premium


Premium


Premium


Premium


Premium