
- Home >
- Stock Photos >
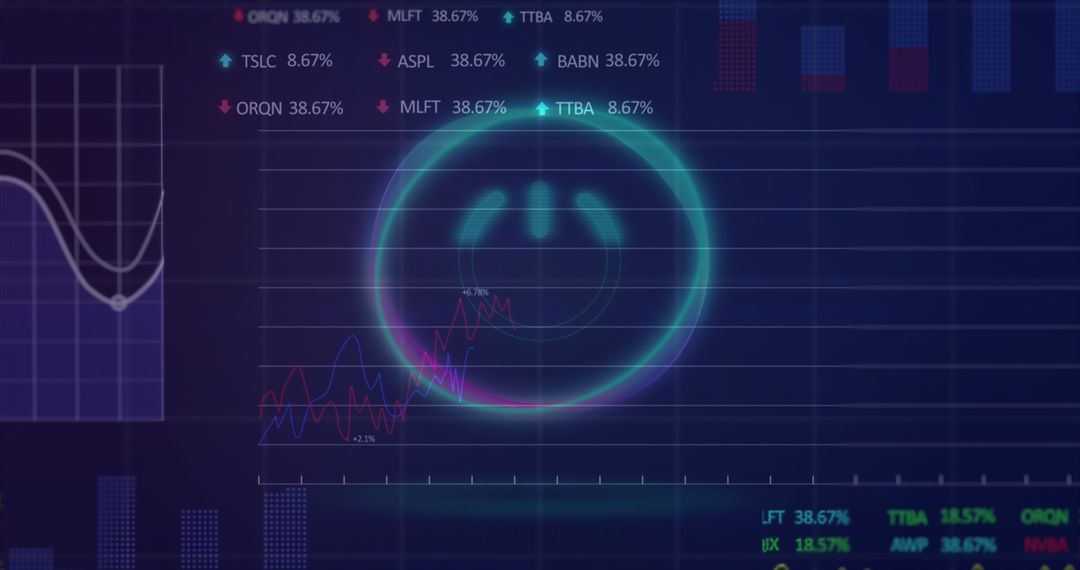
- Neon Holographic Trading Dashboard with Dual-Line Charts, Global Map and Percent Tickers
Neon Holographic Trading Dashboard with Dual-Line Charts, Global Map and Percent Tickers Image

Displaying neon holographic trading dashboard featuring dual red and blue line charts over grid, globe silhouettes, and percent tickers in cool blue and purple palette. Conveying high-tech finance themes, market volatility, and global trading networks. Suiting fintech landing pages, financial reports, investment pitch decks, business presentations, social media campaigns, and technology magazine covers. Allowing easy overlay of headline text on open right-side area; suggesting cropping to hero banner proportions or animating line graphs for video backgrounds. Highlighting key metrics by brightening percent tickers or isolating chart area for infographics. Providing strong visual for articles about market analysis, trading algorithms, data visualization, and fintech startups. Offering alt text suggestion: 'Neon holographic trading dashboard with red and blue line charts, globe silhouettes and percent tickers'.
Powered by  - Get 15% off with code: PIKWIZARD15


0
downloads
downloads
Tags:
More
Credit Photo
If you would like to credit the Photo, here are some ways you can do so
Text Link
photo Link
<span class="text-link">
<span>
<a target="_blank" href=https://pikwizard.com/photo/neon-holographic-trading-dashboard-with-dual-line-charts-global-map-and-percent-tickers/5fe75311ff3f62121b365648b66003ee/>PikWizard</a>
</span>
</span>
<span class="image-link">
<span
style="margin: 0 0 20px 0; display: inline-block; vertical-align: middle; width: 100%;"
>
<a
target="_blank"
href="https://pikwizard.com/photo/neon-holographic-trading-dashboard-with-dual-line-charts-global-map-and-percent-tickers/5fe75311ff3f62121b365648b66003ee/"
style="text-decoration: none; font-size: 10px; margin: 0;"
>
<img src="https://pikwizard.com/pw/medium/5fe75311ff3f62121b365648b66003ee.jpg" style="margin: 0; width: 100%;" alt="" />
<p style="font-size: 12px; margin: 0;">PikWizard</p>
</a>
</span>
</span>
Free (free of charge)
Free for personal and commercial use.
Author: Creative Art
Similar Free Stock Images

Premium


Premium


Premium


Premium


Premium


Premium


Premium


Premium


Premium


Premium


Premium


Premium


Premium


Premium


Premium


Premium


Premium


Premium


Premium


Premium


Premium


Premium


Premium


Premium

