
- Home >
- Stock Photos >
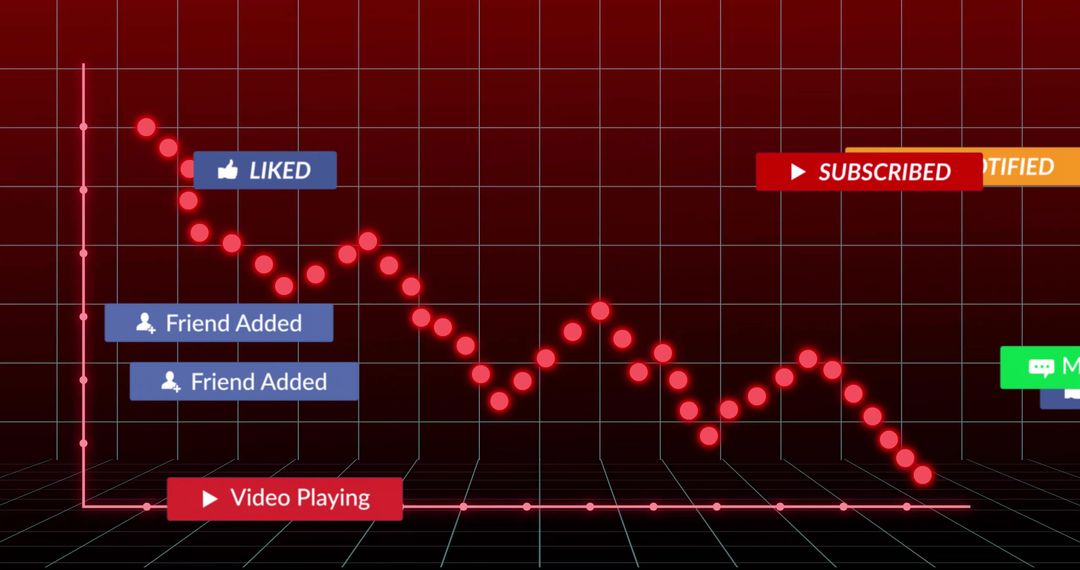
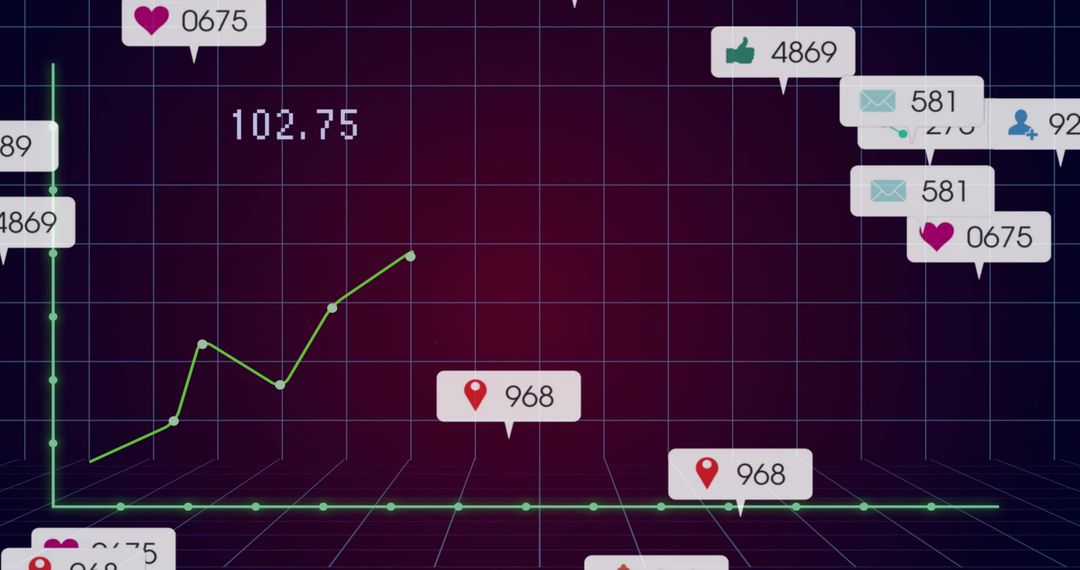
- Neon Social Media Analytics Line Chart with Engagement Bubbles Showing Likes Comments
Neon Social Media Analytics Line Chart with Engagement Bubbles Showing Likes Comments Image

Neon green line chart with circular markers over dark grid background, gradient glow, and blue engagement bubbles displaying heart 27, user 19, like 10, comment icon. Suggesting social media engagement trends, follower growth, and interaction metrics. Suiting presentations, reports, blog headers, website hero sections, marketing dashboards, app UI mockups, seminar slides, and infographics. Working well for visualizing campaign performance, illustrating data-driven insights, creating tutorial graphics about analytics, and enhancing articles about digital marketing and social media strategy. Leaving space for overlaying headline or logo on right side. Featuring dark tech palette with neon accents, easy to recolor to match brand identity.
Powered by  - Get 15% off with code: PIKWIZARD15


0
downloads
downloads
Tags:
More
Credit Photo
If you would like to credit the Photo, here are some ways you can do so
Text Link
photo Link
<span class="text-link">
<span>
<a target="_blank" href=https://pikwizard.com/photo/neon-social-media-analytics-line-chart-with-engagement-bubbles-showing-likes-comments/9ce682b3e078b2e7c317874276468109/>PikWizard</a>
</span>
</span>
<span class="image-link">
<span
style="margin: 0 0 20px 0; display: inline-block; vertical-align: middle; width: 100%;"
>
<a
target="_blank"
href="https://pikwizard.com/photo/neon-social-media-analytics-line-chart-with-engagement-bubbles-showing-likes-comments/9ce682b3e078b2e7c317874276468109/"
style="text-decoration: none; font-size: 10px; margin: 0;"
>
<img src="https://pikwizard.com/pw/medium/9ce682b3e078b2e7c317874276468109.jpg" style="margin: 0; width: 100%;" alt="" />
<p style="font-size: 12px; margin: 0;">PikWizard</p>
</a>
</span>
</span>
Free (free of charge)
Free for personal and commercial use.
Author: Creative Art
Similar Free Stock Images

Premium


Premium


Premium


Premium


Premium


Premium


Premium


Premium


Premium


Premium


Premium


Premium


Premium


Premium


Premium


Premium


Premium


Premium


Premium


Premium


Premium


Premium


Premium


Premium

