- Home >
- Stock Photos >
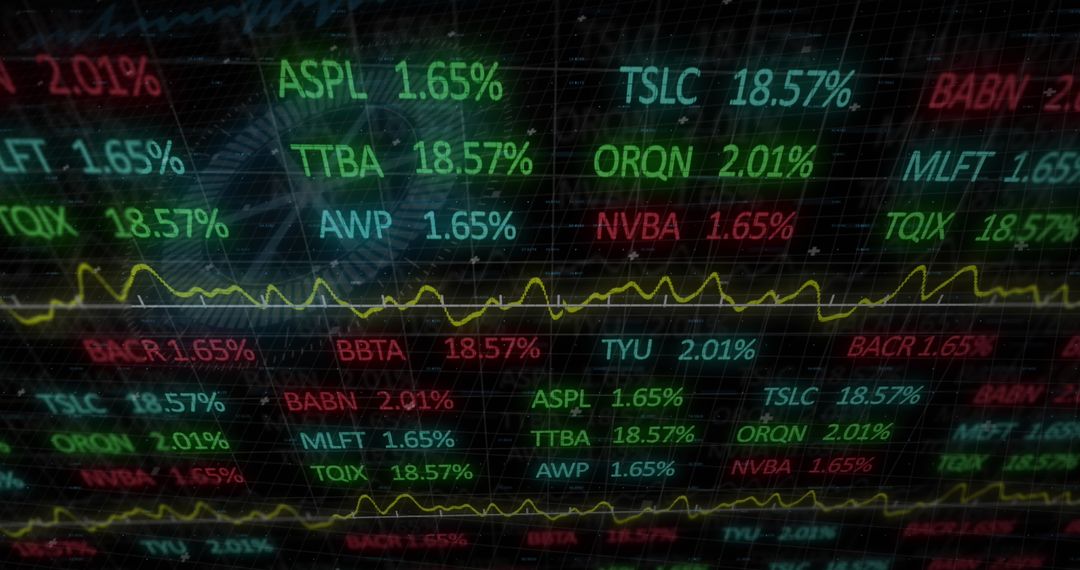
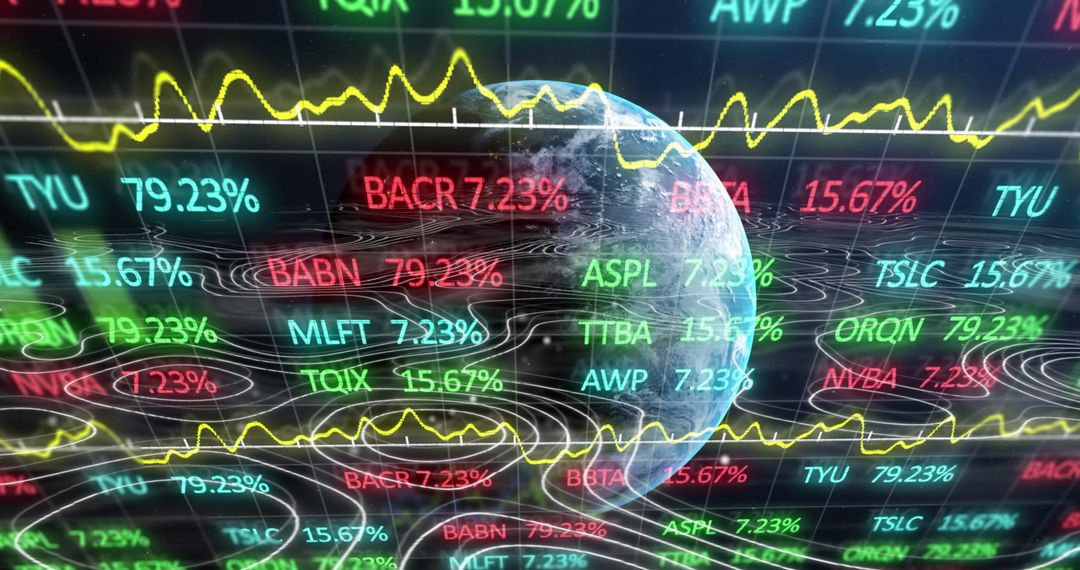
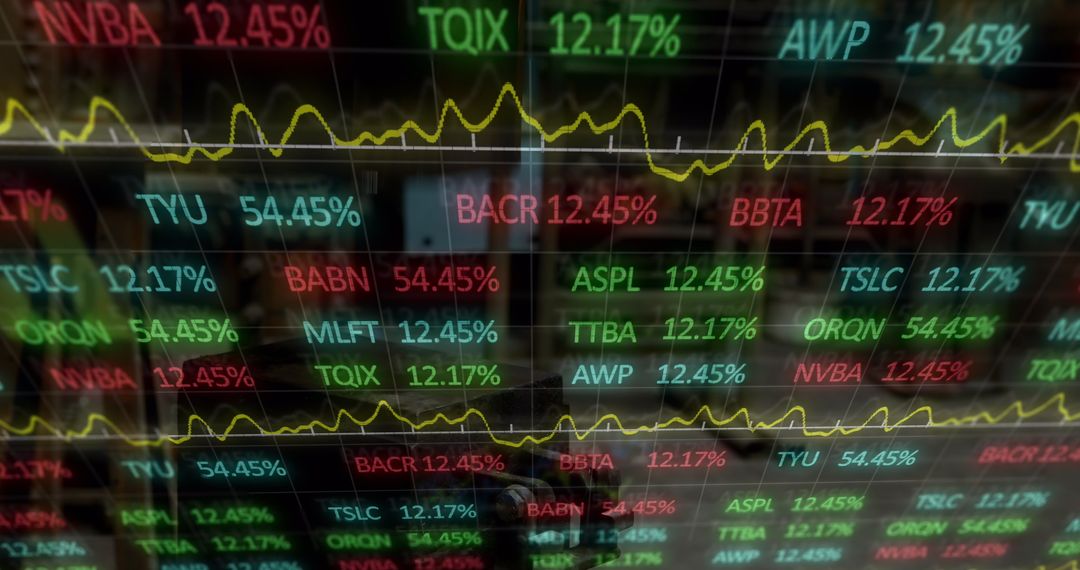
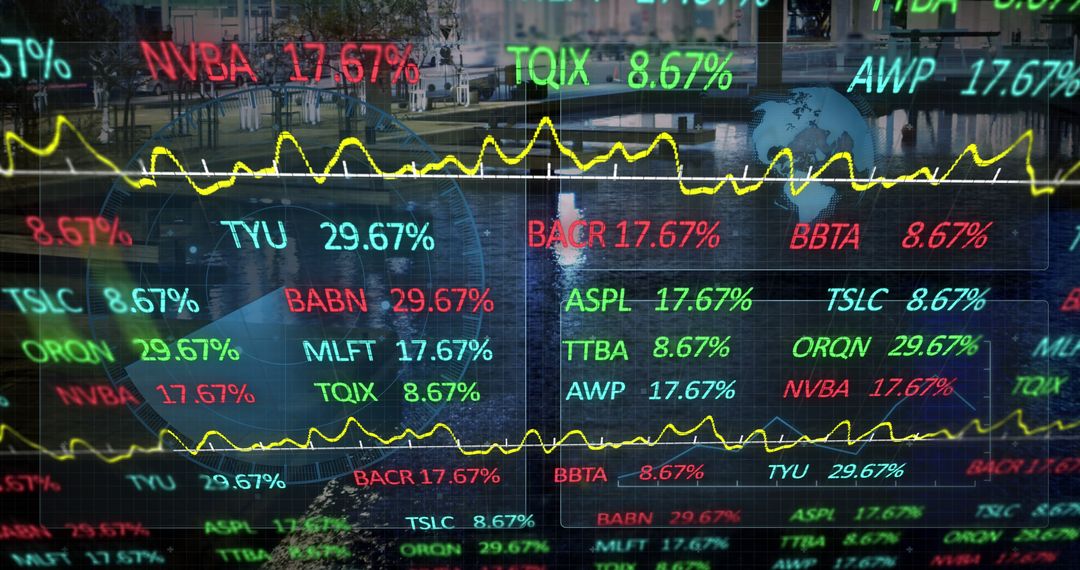
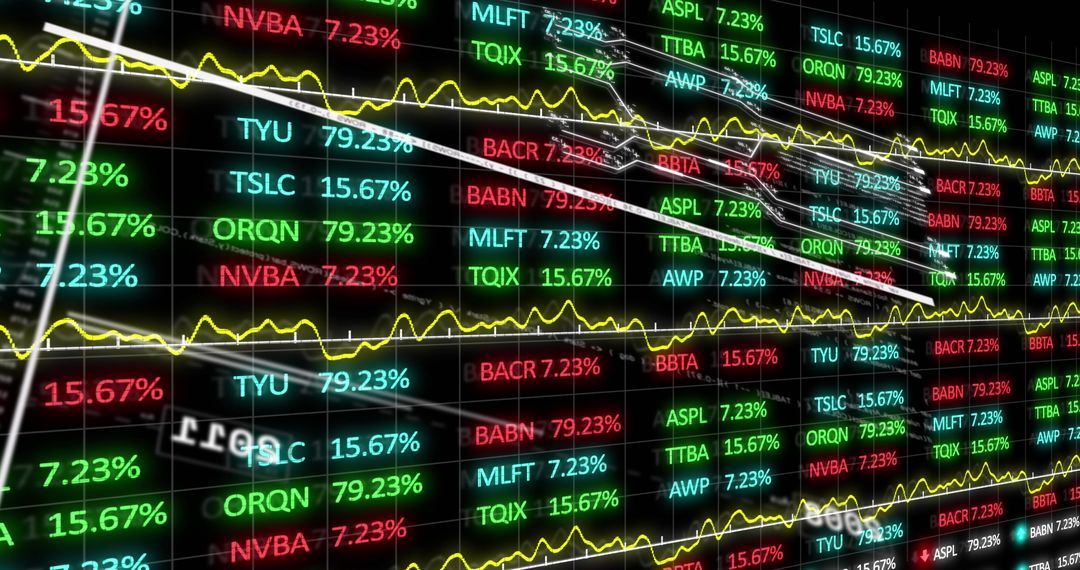
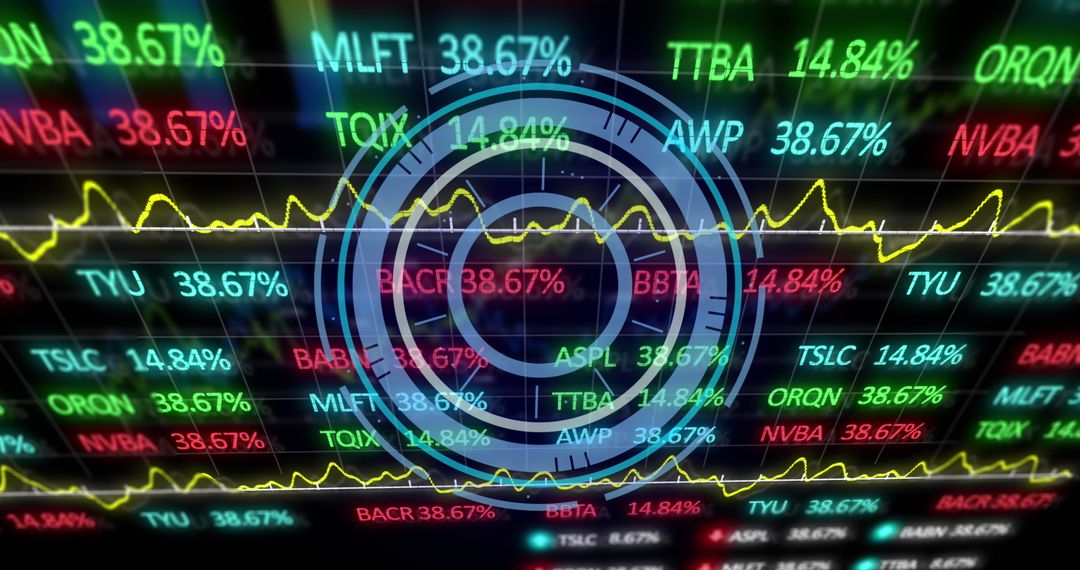
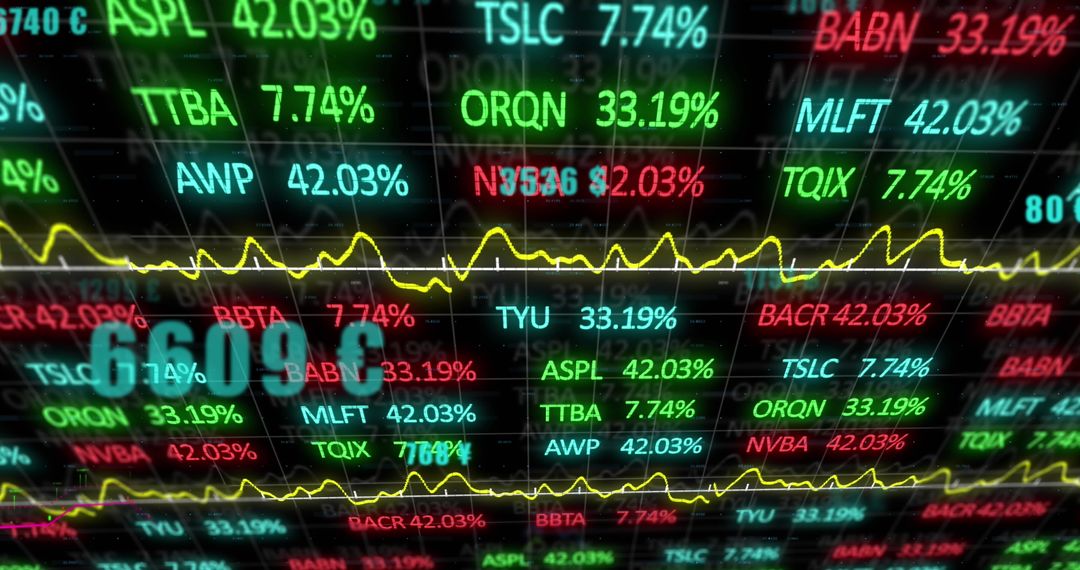
- Neon Stock Market Dashboard with Animated Data Interface
Neon Stock Market Dashboard with Animated Data Interface Image
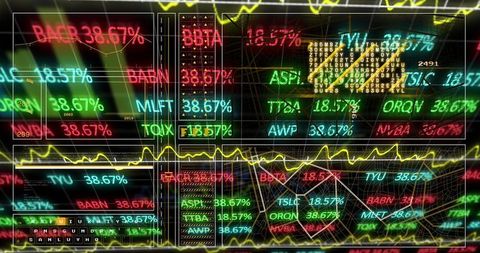
Atmospheric representation of a digital stock market dashboard with neon overlays, illustrating dynamic analytics and financial data visualization. Ideal for financial technology presentations, stock market analysis reports, or marketing visual projects focused on innovation and cutting-edge technology in finance. Can be used in articles and media content related to data science, stock trading diagnostics or real-time trend monitoring.
Powered by 


2
downloads
downloads
Tags:
More
Credit Photo
If you would like to credit the Photo, here are some ways you can do so
Text Link
photo Link
<span class="text-link">
<span>
<a target="_blank" href=https://pikwizard.com/photo/neon-stock-market-dashboard-with-animated-data-interface/34adac7d1fb9a28f27f2350eb7bb8b7a/>PikWizard</a>
</span>
</span>
<span class="image-link">
<span
style="margin: 0 0 20px 0; display: inline-block; vertical-align: middle; width: 100%;"
>
<a
target="_blank"
href="https://pikwizard.com/photo/neon-stock-market-dashboard-with-animated-data-interface/34adac7d1fb9a28f27f2350eb7bb8b7a/"
style="text-decoration: none; font-size: 10px; margin: 0;"
>
<img src="https://pikwizard.com/pw/medium/34adac7d1fb9a28f27f2350eb7bb8b7a.jpg" style="margin: 0; width: 100%;" alt="" />
<p style="font-size: 12px; margin: 0;">PikWizard</p>
</a>
</span>
</span>
Free (free of charge)
Free for personal and commercial use.
Author: Awesome Content
Similar Free Stock Images

Premium


Premium


Premium


Premium


Premium


Premium

Premium


Premium


Premium


Premium


Premium

Premium


Premium


Premium


Premium


Premium


Premium

Premium


Premium


Premium


Premium


Premium


Premium


Premium