- Home >
- Stock Photos >
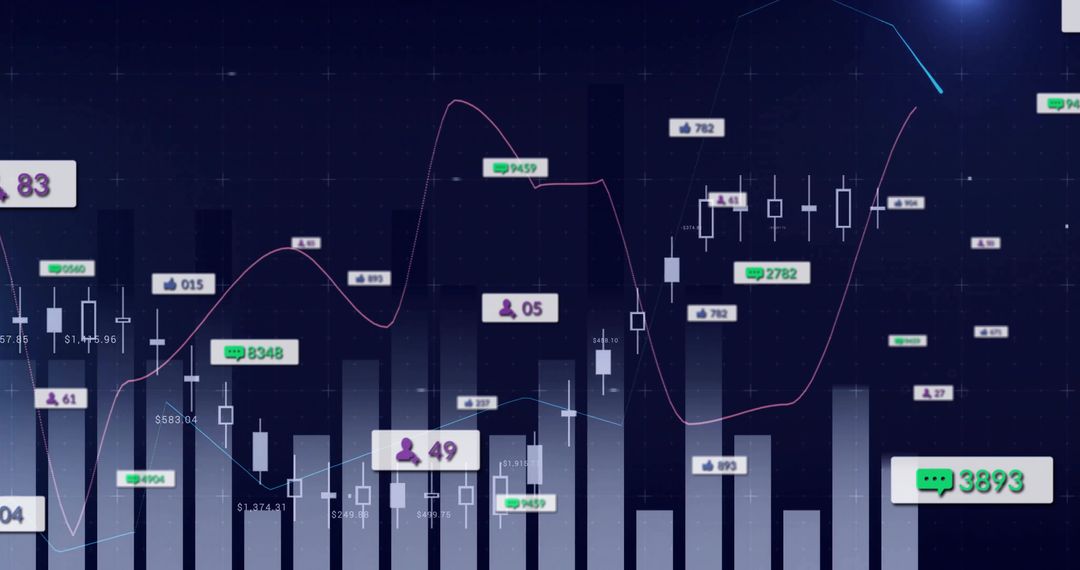
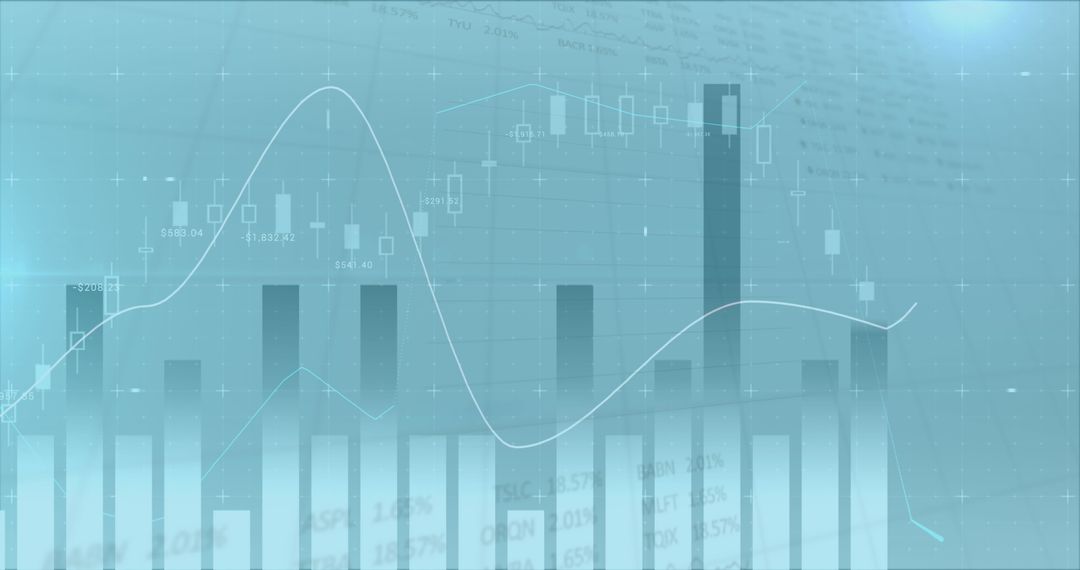
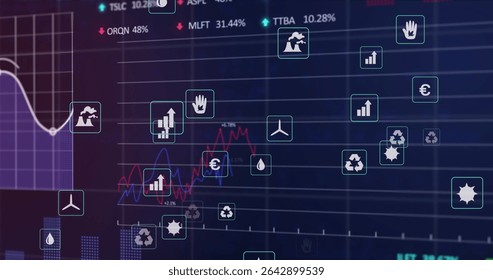
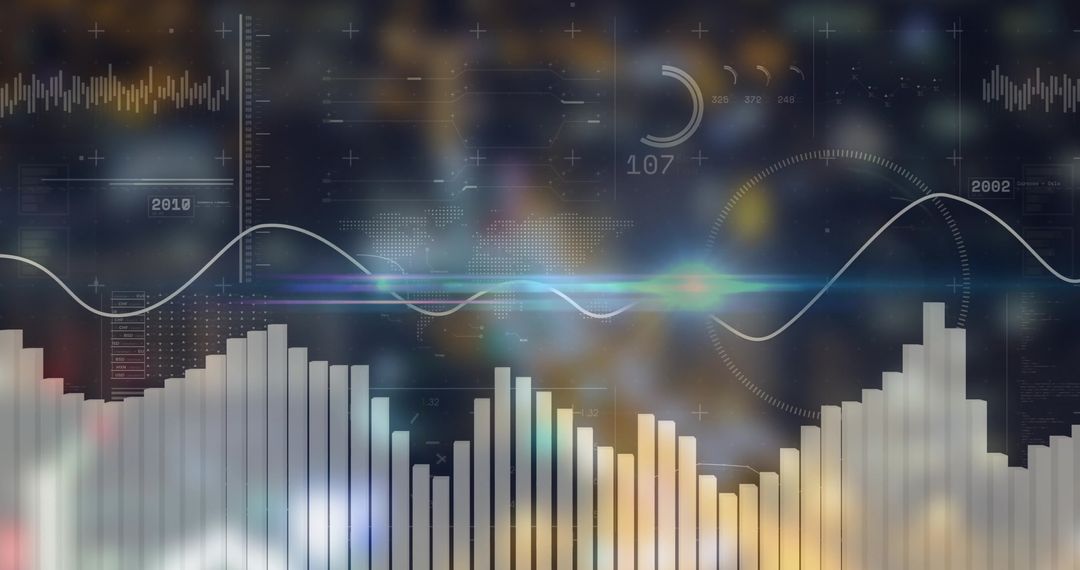
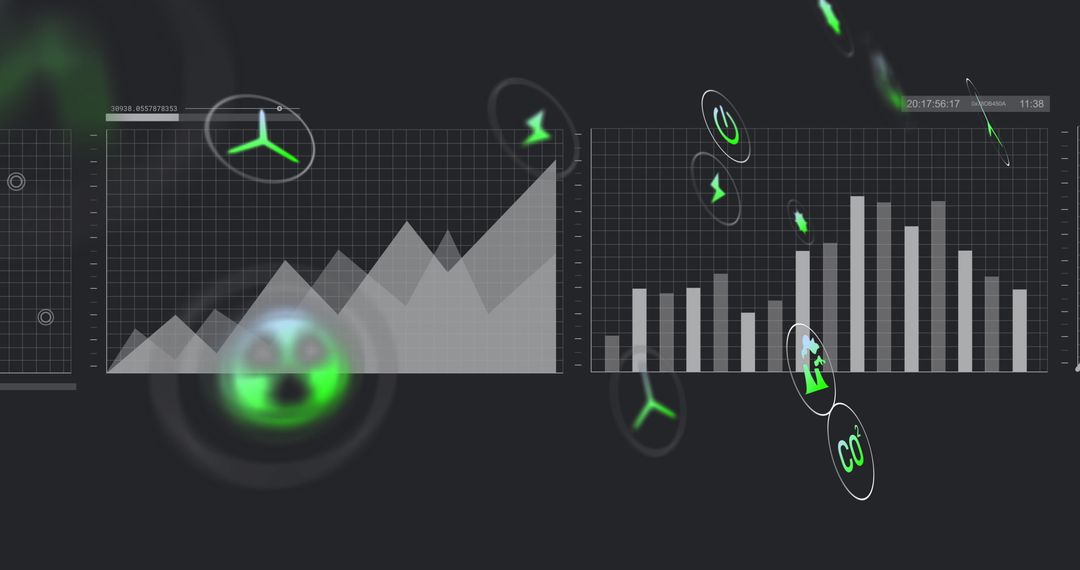
- Neon sustainability finance dashboard showing CO2 EV euro metrics with candlestick charts
Neon sustainability finance dashboard showing CO2 EV euro metrics with candlestick charts Image
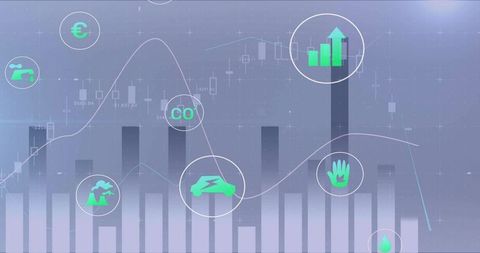
Futuristic finance dashboard showing vertical bar chart, candlestick chart, and flowing trend lines over muted gradient background. Neon icons representing CO2, euro currency, electric vehicle, factory emissions, hand, and water droplet floating above bars to link sustainability metrics with market performance. Subtle grid and numeric labels creating analytic atmosphere for editorial and corporate use. Usage ideas: - Supporting articles and presentations about green finance, carbon markets, ESG investing, and energy transition. - Enhancing corporate reports, investor decks, fintech landing pages, and blog posts on sustainable investing. - Serving as hero banner, webinar backdrop, social media post, or slide cover where data-driven sustainability theme needed. Technical notes: - High contrast neon elements on muted gradient allowing overlaying of logos and white text. - Multiple crop options suitable for wide banners, square social posts, and vertical slide covers. - Color palette featuring teal and mint accents ideal for modern finance and tech layouts.
Powered by  - Get 15% off with code: PIKWIZARD15


0
downloads
downloads
Tags:
More
Credit Photo
If you would like to credit the Photo, here are some ways you can do so
Text Link
photo Link
<span class="text-link">
<span>
<a target="_blank" href=https://pikwizard.com/photo/neon-sustainability-finance-dashboard-showing-co2-ev-euro-metrics-with-candlestick-charts/8f7641dedc6eb203681c38bf14ba3da9/>PikWizard</a>
</span>
</span>
<span class="image-link">
<span
style="margin: 0 0 20px 0; display: inline-block; vertical-align: middle; width: 100%;"
>
<a
target="_blank"
href="https://pikwizard.com/photo/neon-sustainability-finance-dashboard-showing-co2-ev-euro-metrics-with-candlestick-charts/8f7641dedc6eb203681c38bf14ba3da9/"
style="text-decoration: none; font-size: 10px; margin: 0;"
>
<img src="https://pikwizard.com/pw/medium/8f7641dedc6eb203681c38bf14ba3da9.jpg" style="margin: 0; width: 100%;" alt="" />
<p style="font-size: 12px; margin: 0;">PikWizard</p>
</a>
</span>
</span>
Free (free of charge)
Free for personal and commercial use.
Author: People Creations
Similar Free Stock Images

Premium


Premium


Premium


Premium


Premium


Premium


Premium


Premium


Premium


Premium


Premium


Premium


Premium


Premium


Premium


Premium


Premium


Premium


Premium


Premium


Premium


Premium


Premium


Premium