- Home >
- Stock Photos >
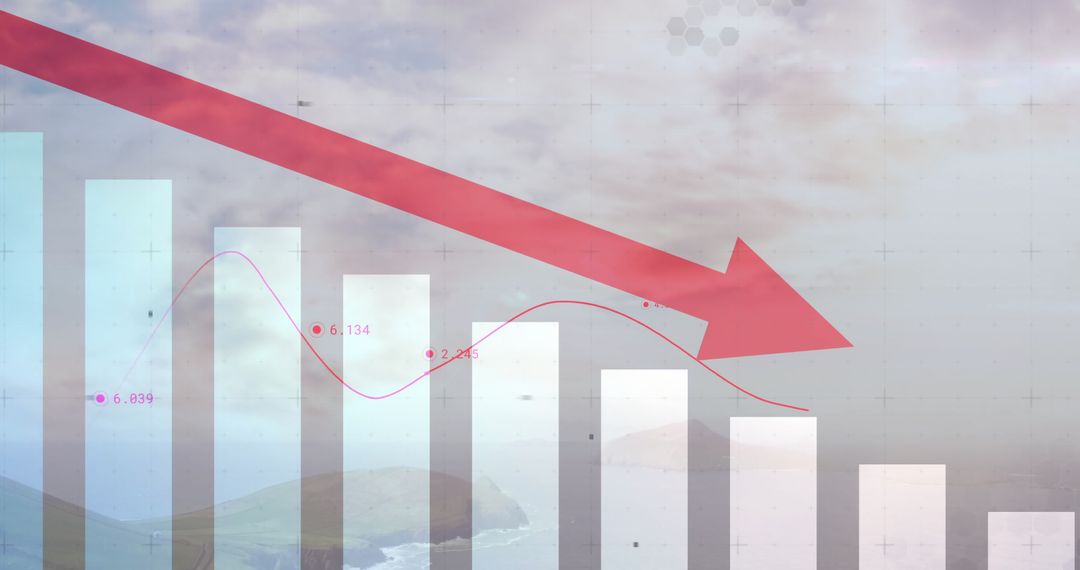
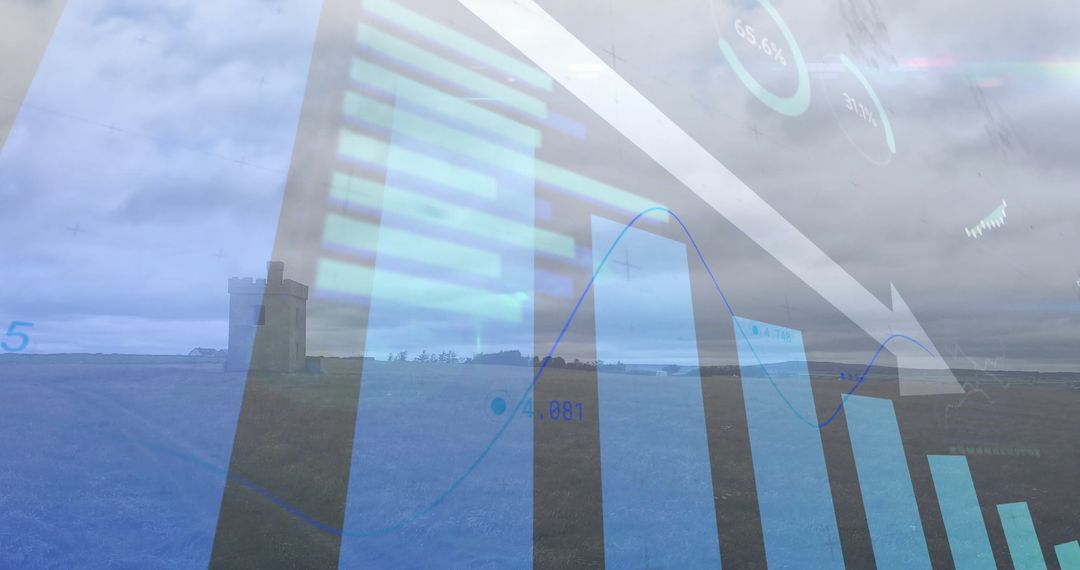
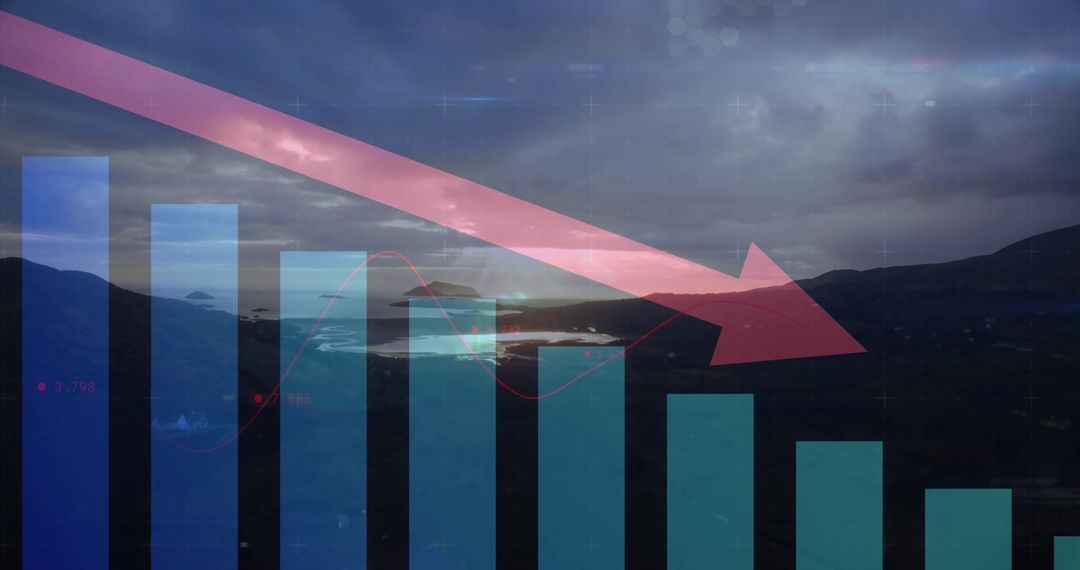
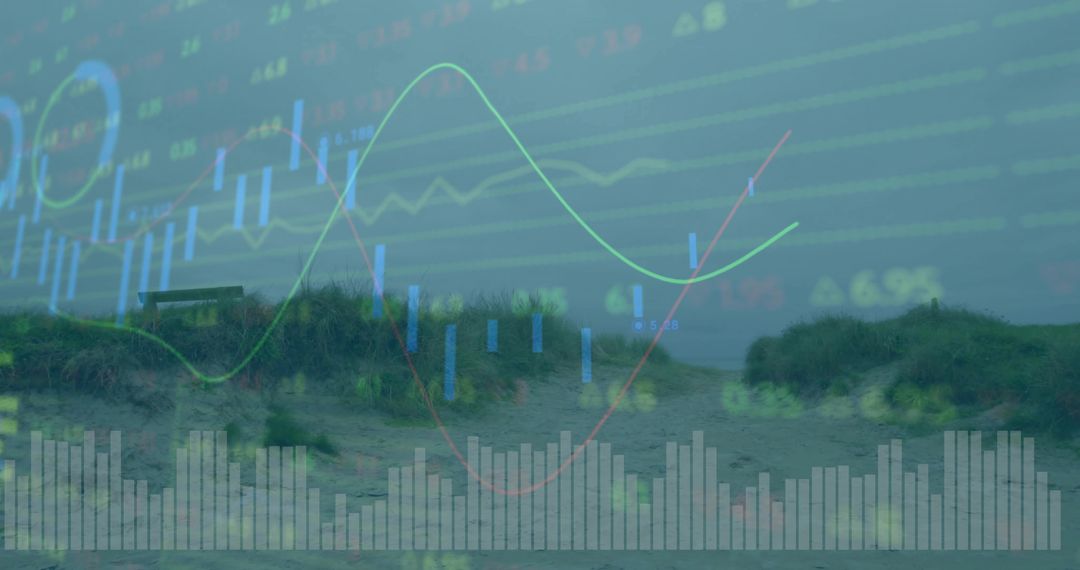
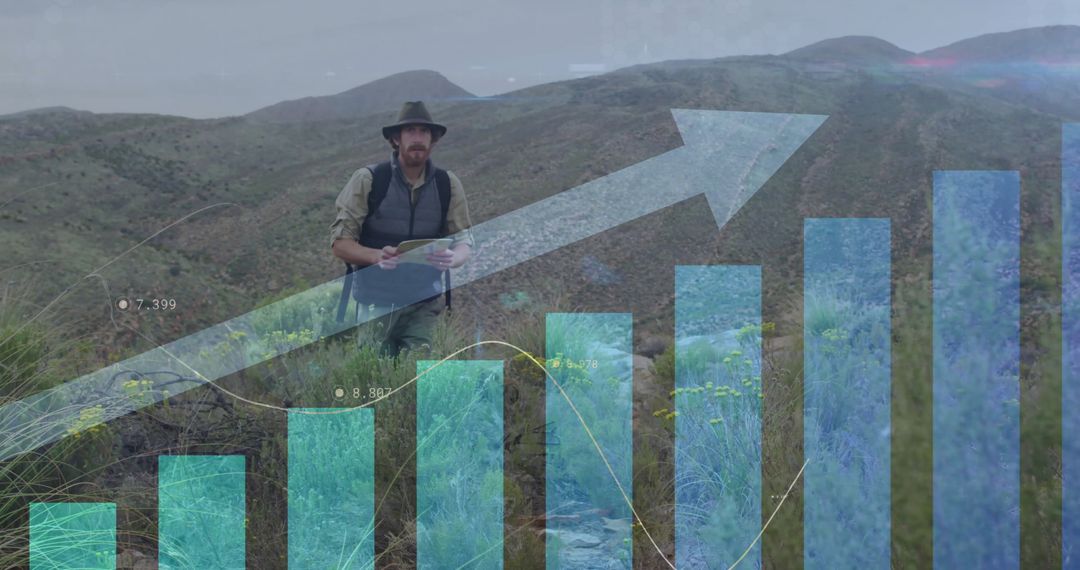
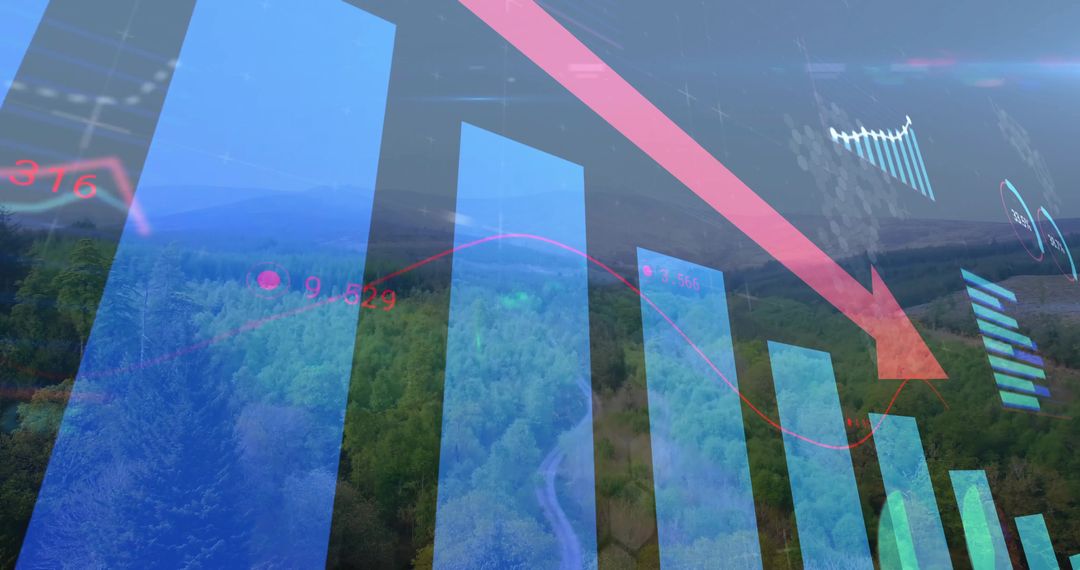
- Overlaying data visualization on coastal dune path showing declining bar chart with red arrow
Overlaying data visualization on coastal dune path showing declining bar chart with red arrow Image

Combining coastal dune path with translucent dashboards and falling red arrow to illustrate decline, risk, or data-driven environmental stories. Suitable for business reports, financial forecasts, economic analysis, climate impact articles, technology and analytics presentations, and marketing materials. Working well as website header, blog hero, slide background, infographic element, or social media visual. Providing moody overcast tones, sandy textures, grassy foreground, and transparent blue bar charts for clean layered composition. Offering space for headline text or overlaying brand graphics with simple cropping for desktop or mobile layouts.
Powered by 


0
downloads
downloads
Tags:
More
Credit Photo
If you would like to credit the Photo, here are some ways you can do so
Text Link
photo Link
<span class="text-link">
<span>
<a target="_blank" href=https://pikwizard.com/photo/overlaying-data-visualization-on-coastal-dune-path-showing-declining-bar-chart-with-red-arrow/4ad8ef9378477165b2e84cbfd169c94a/>PikWizard</a>
</span>
</span>
<span class="image-link">
<span
style="margin: 0 0 20px 0; display: inline-block; vertical-align: middle; width: 100%;"
>
<a
target="_blank"
href="https://pikwizard.com/photo/overlaying-data-visualization-on-coastal-dune-path-showing-declining-bar-chart-with-red-arrow/4ad8ef9378477165b2e84cbfd169c94a/"
style="text-decoration: none; font-size: 10px; margin: 0;"
>
<img src="https://pikwizard.com/pw/medium/4ad8ef9378477165b2e84cbfd169c94a.jpg" style="margin: 0; width: 100%;" alt="" />
<p style="font-size: 12px; margin: 0;">PikWizard</p>
</a>
</span>
</span>
Free (free of charge)
Free for personal and commercial use.
Author: Awesome Content
Similar Free Stock Images

Premium


Premium


Premium


Premium


Premium


Premium


Premium


Premium


Premium


Premium


Premium


Premium


Premium


Premium


Premium


Premium


Premium


Premium


Premium


Premium


Premium


Premium


Premium


Premium