- Home >
- Stock Photos >
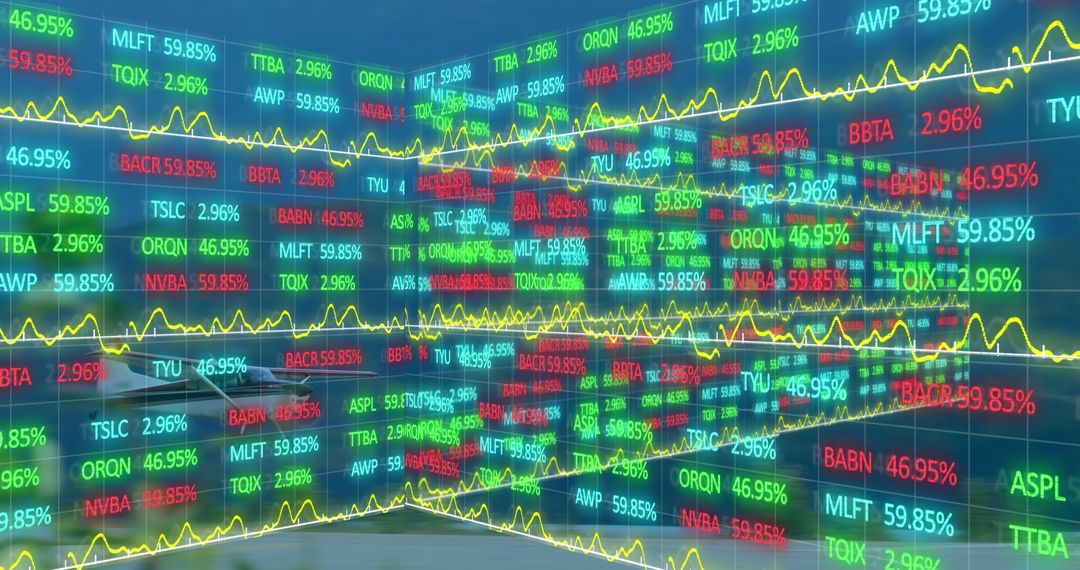
- Pink Overlay Stock Market Data with Candlestick Charts
Pink Overlay Stock Market Data with Candlestick Charts Image

AI Generated Image. Bright, pink-tinted digital displays showcasing active candlestick charts convey fast-paced trading activity in stock markets. Useful for illustrating financial news, representing trading scenarios in finance blogs, or enhancing investment seminar presentations with vivid technical analysis visuals.
Powered by 


0
downloads
downloads
Tags:
More
Credit Photo
If you would like to credit the Photo, here are some ways you can do so
Text Link
photo Link
<span class="text-link">
<span>
<a target="_blank" href=https://pikwizard.com/photo/pink-overlay-stock-market-data-with-candlestick-charts/2622c17a8f3860bab4ab974d395ce1e4/>PikWizard</a>
</span>
</span>
<span class="image-link">
<span
style="margin: 0 0 20px 0; display: inline-block; vertical-align: middle; width: 100%;"
>
<a
target="_blank"
href="https://pikwizard.com/photo/pink-overlay-stock-market-data-with-candlestick-charts/2622c17a8f3860bab4ab974d395ce1e4/"
style="text-decoration: none; font-size: 10px; margin: 0;"
>
<img src="https://pikwizard.com/pw/medium/2622c17a8f3860bab4ab974d395ce1e4.jpg" style="margin: 0; width: 100%;" alt="" />
<p style="font-size: 12px; margin: 0;">PikWizard</p>
</a>
</span>
</span>
Free (free of charge)
Free for personal and commercial use.
Author: AI Creator
Similar Free Stock Images

Premium


Premium


Premium


Premium


Premium


Premium


Premium


Premium


Premium


Premium


Premium


Premium


Premium


Premium


Premium


Premium


Premium


Premium


Premium


Premium


Premium


Premium


Premium


Premium