1. Home > 
  2. Stock Photos > 
  3. Professional Analyst Examining Red Line Graphs for Financial Insights

Professional Analyst Examining Red Line Graphs for Financial Insights Image

Professional Analyst Examining Red Line Graphs for Financial Insights

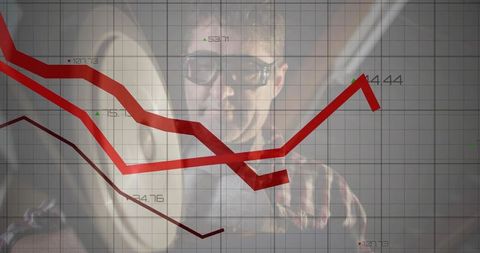
This image features a mature financial analyst, dressed in glasses and a plaid shirt, engaging in examining financial charts with red line graphs. Perfect for illustrating analysis, financial research, business performance evaluation, corporate presentations, economic forecasts, modern enterprise scenarios, and professional analytical environments.

Powered by Shutterstock logo - Get 15% off with code: PIKWIZARD15
Businessman's hand touches virtual screen displaying "risk" text with falling red graph, illustrating risk analysis and management - Powered by Shutterstock - Get 15% off with code: PIKWIZARD15Stressed business man crypto trader broker investor analyzing stock exchange market crypto trading decreasing chart data fall down loss, desperate about losing money of crisis, recession, inflation. - Powered by Shutterstock - Get 15% off with code: PIKWIZARD15Writing analyst tracing red line graph across notebook on desk, with pen smartphone grid overlay. Data, analysis, productivity, accuracy, innovation, focus, technology - Powered by Shutterstock - Get 15% off with code: PIKWIZARD15Tapping smartphone at cafe table with hands in red blue plaid shirt, overlaying financial graphs. Technology, data visualization, casual workspace, finance, mobile device, modern design, analysis - Powered by Shutterstock - Get 15% off with code: PIKWIZARD15Pie charts and financial graphs image over blurred red lights background. Finance, financials, analytics, data, economy, statistics - Powered by Shutterstock - Get 15% off with code: PIKWIZARD15

Credit Photo

If you would like to credit the Photo, here are some ways you can do so

Free (free of charge)

Free for personal and commercial use.

Author: People Creations

Similar Free Stock Images

Rising Financial Statistics on Digital Grid Background
Premium
Teamwork of crypro stock analysts.Technical price graph and indicator, red and green candlestick chart and stock trading computer screen background. Double exposure
Bitcoin Value Decline with Red Graph on Grayscale Grid
Financial Decline on Digital Warehouse Background
Digital Graph Overlay in Warehouse Environment Background
Financial Crisis Concept with Declining Graph and Disappointed Businessperson
Premium
Data analyst in striped polo leaning toward bar chart on grid, with 3D-rendered bars, copy space. Analytics, data visualization, financial, futuristic, professional, digital, insights
Business Data Trends with COVID-19 Cell Background
Green Line Graph Showing Upward Financial Trends and Growth
Stock Market Decline Concept with Business Figures
Woman Combining Fitness with Business Challenges: Financial Graph Overlay
Premium
Businesswoman reviewing financial charts on digital tablet and holding stylus at office workspace. Corporate, data analysis, modern design, finance, productivity, professional, technology
Financial Analysis Concept with Smartphone Usage
Global Finance Indicators Falling with Red Line on Grid
Financial Downtrend in Urban Overview with Silhouettes
Global Financial Downturn Over Map with Red Graph Line
Premium
Image shows a stressed person holding their head, overlaid with financial graphs and red downward arrows. Background features urban buildings, representing stock market downturn concept
Financial Data Visualization with Grid and Graph Lines
Digital Financial Graphs Overlapping Modern Office Scene
Red Line Graph Showing Financial Decline on Grid Background
Falling Stock Market with Red Downward Graph and Numbers
Premium
Close-up of eyeglasses with red frames on a printed bar chart showing progress during a meeting of business analysts, in the office of a successful company
Financial Data with Downward Trending Red Line Graph on Grid
Financial Crisis Concept with Declining Graph in Modern Hallway
Digital Dashboard Visualization of Declining Market Data Trends
Businesswomen Analyzing Financial Graph and Data in Modern Office
Premium
Business analyst financial data with graph strategies concept, businessman using laptop to analyst market data, innovative solutions for corporate growth, investment with a captivating data analysis.
Futuristic Financial Data Dashboard with 3D Global Interface
Medical Professionals Analyzing Data Trends in Healthcare
Asian Professional Analyzing Declining Line Charts with Technology
Ascending Graph Lines on Data Dashboard Visual Spreadsheet
Abstract Financial Data Visualization with Dynamic Graphs
Financial Crisis Reducing Stock Value Global Impact Chart
Premium
Investment Finance, Risk volatility management. Decision uncertainty caution. Risk assessment. Financial concept. A man is holding a magnifying glass over a computer screen with a red warning sign.
Green Line Processing Over Clock with Business Analytics
Fitness Data Integration with Gym Exercise
Economic Data Visualization of Chad Flag Colors
Digital Data Interface Over Cityscape at Night
Premium
Displaying colorful bar graph with green line on computer monitors at trading desk, with keyboard. Financial analysis, data visualization, business intelligence, technological innovation
Rising Graph Line Over Digital Grid Background
Green Line Graph on Grid Interface Displaying Financial Data Trends
Declining Financial Chart with Red Lines on Data Grid
Graph Visualizing Economic Downtrend and Financial Data
Premium
Close up hand holding red felt-pen marks important data, analyze business report filled with charts, graphs, analytical insights, engaged in financial review, market research, performance evaluation
Business Presentation with Interactive Data Visualization
Digital Icons and Data Trends in Server Room Environment
Rising Economic Data Overlapping Modern Architecture
Business Team Analyzing Downward Trend with Financial Graphs
Premium
Analyzing data woman in plaid shirt reviewing line graphs, bar charts at office desk, copy space. Analytics, finance, visualization, workspace, technology, professional, modern
Data Visualization Digital Chart Display on White Background
Analyzing Financial Data Over Cityscape Grid Chart
Dynamic Financial Data Analysis on Graph
Digital Green Graph Lines on Grid Showing Business Analytics
Premium
Female analyst at her desk works on a laptop showing statistics, graphs while working at Christmas. She Works on the Table packing package gift with red ribbon in creative office. Over the shoulder
Global Financial Trends with Moving Graphs and Digital Globe
Dynamic Green Line Graph on Digital Dashboard
Digital Financial Dashboard with Glowing Pound and Rising Chart
Doctor Walking with Data Overlays in Hospital Corridor
Premium
Businessman pen touch financial virtual screen, falling forex candlesticks and graph lines hud. Concept of stock market collapse, crisis, sales and risk management
Doctors Analyzing Data with Medical Graphs in Hospital Setting
Determined Athlete Analyzing Performance Trends in Gym Setting
Rising Graphs with Urban Skyline at Sunset
Dynamic Graph Lines Over Digital Grid Background
Dynamic Financial Data Processing with Ascending Lines
Red Line Graph with Office Abstract Network Background
Premium
Data Analysis text with speech bubble and magnifying glass on red background
Green Line Graph Over Digital Grid Highlighting Data Trends
IT Engineers Analyzing Data Trends Amidst Servers
Economic Downturn During Health Crisis Visualization
Active Lifestyle Discussion in Gym with Performance Overview
Premium
Analyzing red line charts in office by Asian analyst, with earbuds glasses grid overlay copy space. Data visualization, financial analysis, contemporary, professional, corporate, technology, analytic
Dynamic Green Line Graph on Data Grid Background
Fluctuating Financial Trends and Market Analysis
Blue Financial Graphs Illustrating Market Growth and Economic Optimism
Dynamic Charts and Lines Displaying Financial Data Trends
Premium
Silhouette analyst scanning digital display in office, with financial charts and tickers. Technology, finance, analytics, digital, data visualization, corporate, business
Business Growth Concepts Illustrated with Diverse Team Collaboration
Senior Couple Managing Finances with Digital Data Overlay
Digital Data Visualization Chart with Trend Lines
Digital Financial Data Processing on Grey Grid Background
Premium
Close-up of eyeglasses during a meeting of business analysts
Abstract Financial Data Virtual Interface on Grid Background
Business Professionals Analyzing Declining Financial Data with Technology
Digital Financial Growth with Green Line Graph and Statistics
Digital Financial Data Overlay Virtual Financial Interface
Premium
Closeup of a businesswoman hands accounting with a black calculator and a laptop sitting in a desktop at office with her red suit in the background
Futuristic Digital Data Dashboard with Rising Line Graph
Visual Dynamic Data Analytics Interface with Finance Graph
Father Playing with Daughter Love and Togetherness Concept
Women Analyzing Business Decline on Digital Graph Interface
Premium
business strategy analysis data, Analyst database development analytic. A woman is drawing on a tablet with a green shirt on. She is creating a graph with a green circle and a red circle.
Businessman Analyzing Line Chart Data in Modern Office
Doctor Analyzing Digital Health Data with Green Graphs in Office
Dynamic Chart and Globe Depict Global Financial Movement
Declining Financial Trends with Red Graph Lines on Grid
Futuristic Data Graph Overlay on Urban Cityscape
Futuristic Cryptocurrency Market Chart with Green Line Progression
Premium
Three analysts analyzing data in suits in office with red-black line graphs, chairs, desks, plant. Corporate, teamwork, analytics, productivity, modern, financial, strategy
China Flag with Declining Stock Market Graph
Rising Financial Trends with Virus Background in Digital Interface
Business and Fitness Fusion: Health Meets Industry Insights
Dynamic Stock Market Trends and Data Visualization
Premium
Mature analyst wearing glasses and plaid shirt analyzing charts in office, with red line graphs. Financial, data, analytics, professional, modern, enterprise, corporate
Falling Statistics with Red Graph on Digital Interface
Red Financial Data Graphic on Grid with Arrow Trendline
Declining Stock Market Trends with Digital World Map
Financial Data Processing and Analysis with Digital Interface
Premium
Korean man viewing stock graphs on glass panel in server room, with safety vest, red headphones. Technology, finance, data, cybersecurity, innovation, analysis, digital
Abstract Digital World Map with Business Diagrams
Declining Financial Graph on Grid Background
Businesswomen Analyzing Financial Data on Tablet in Office Setting
Financial Downtrend and Data Analysis Concept
Premium
African American man reviewing market data at office desk, with tablet laptop overlay, copy space. Professional, analytical, modern, finance, technology, workspace, digital
Red Line Graph Representing Financial Downturn on Dark Grid Background
Declining Financial Market Trends with Red Graph Lines
Graph Decline with Businessman Reflected in Economic Concept
Futuristic Data Analysis Interface with Green Trend Lines
Premium
Concept of financial crisis. Businessman drawing decreasing graph on data chart
Financial Growth Chart Transparency in Corporate Office
Soccer Player with Data Overlay Showcasing Sports Analytics
Futuristic Globe with Rising Business Graphs and Data Metrics
Healthcare Professionals Analyzing Digital Downward Trend in Clinic
Premium
Businesswoman in a office analyzes complex crisis market data on a dlaptop. Detailed financial graphs indicate a high-pressure, data driven work environment, forex background
Displaying Blue Trend Lines on Grid Analytics Dashboard with Markers and Data Values