- Home >
- Stock Photos >
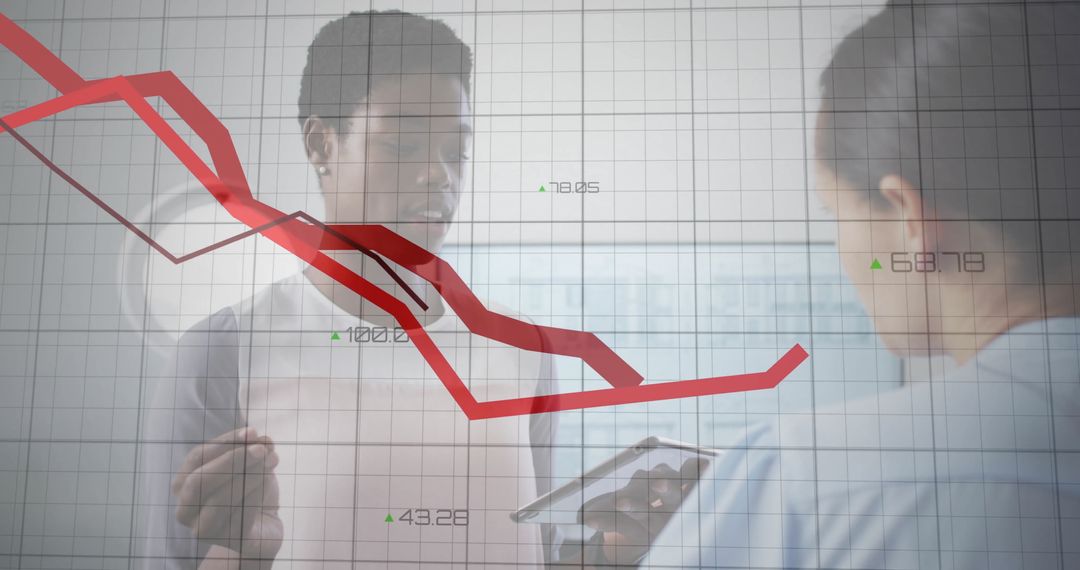
- Professional Analyzing Spinal Model Amid Falling Chart Trends
Professional Analyzing Spinal Model Amid Falling Chart Trends Image
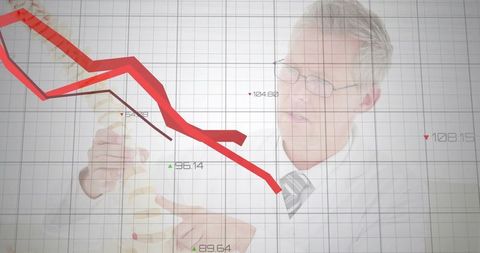
Business expert is engaging with spinal healthcare data against backdrop of declining chart. Powerful image for use in financial presentations or editorials discussing trends in healthcare costs or economic impacts on medical industry.
Powered by  - Get 15% off with code: PIKWIZARD15


0
downloads
downloads
Tags:
More
Credit Photo
If you would like to credit the Photo, here are some ways you can do so
Text Link
photo Link
<span class="text-link">
<span>
<a target="_blank" href=https://pikwizard.com/photo/professional-analyzing-spinal-model-amid-falling-chart-trends/1b1b386400704ec3e7f8427920cb0f8d/>PikWizard</a>
</span>
</span>
<span class="image-link">
<span
style="margin: 0 0 20px 0; display: inline-block; vertical-align: middle; width: 100%;"
>
<a
target="_blank"
href="https://pikwizard.com/photo/professional-analyzing-spinal-model-amid-falling-chart-trends/1b1b386400704ec3e7f8427920cb0f8d/"
style="text-decoration: none; font-size: 10px; margin: 0;"
>
<img src="https://pikwizard.com/pw/medium/1b1b386400704ec3e7f8427920cb0f8d.jpg" style="margin: 0; width: 100%;" alt="" />
<p style="font-size: 12px; margin: 0;">PikWizard</p>
</a>
</span>
</span>
Free (free of charge)
Free for personal and commercial use.
Author: People Creations
Similar Free Stock Images

Premium


Premium


Premium


Premium


Premium


Premium


Premium


Premium


Premium