- Home >
- Stock Photos >
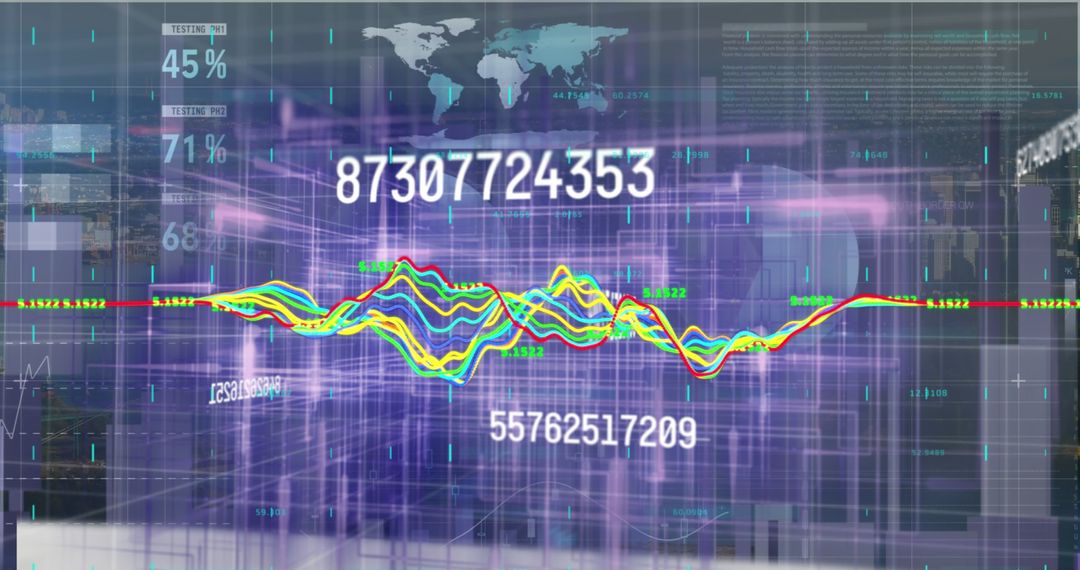
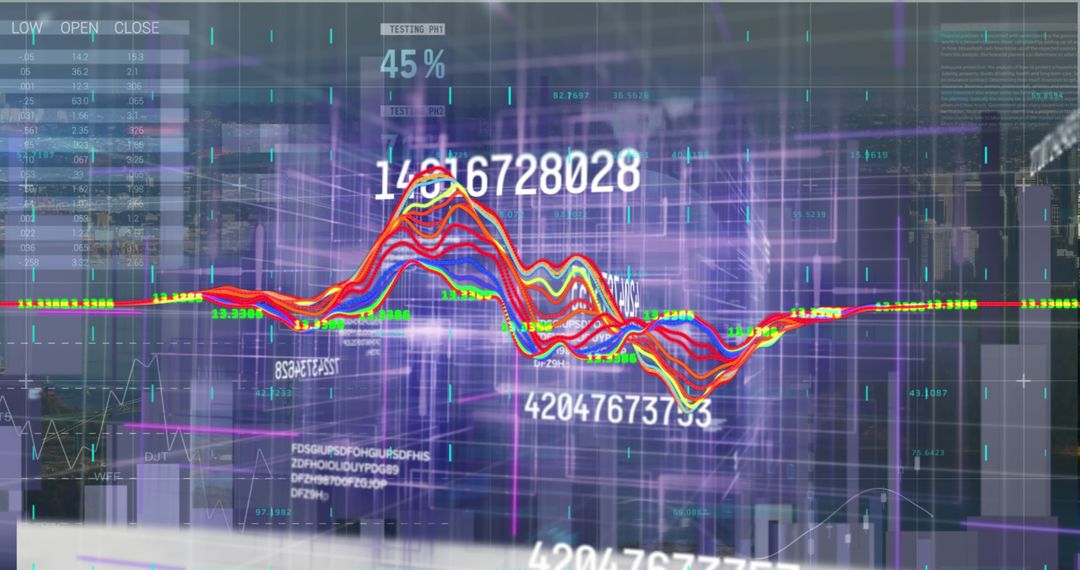
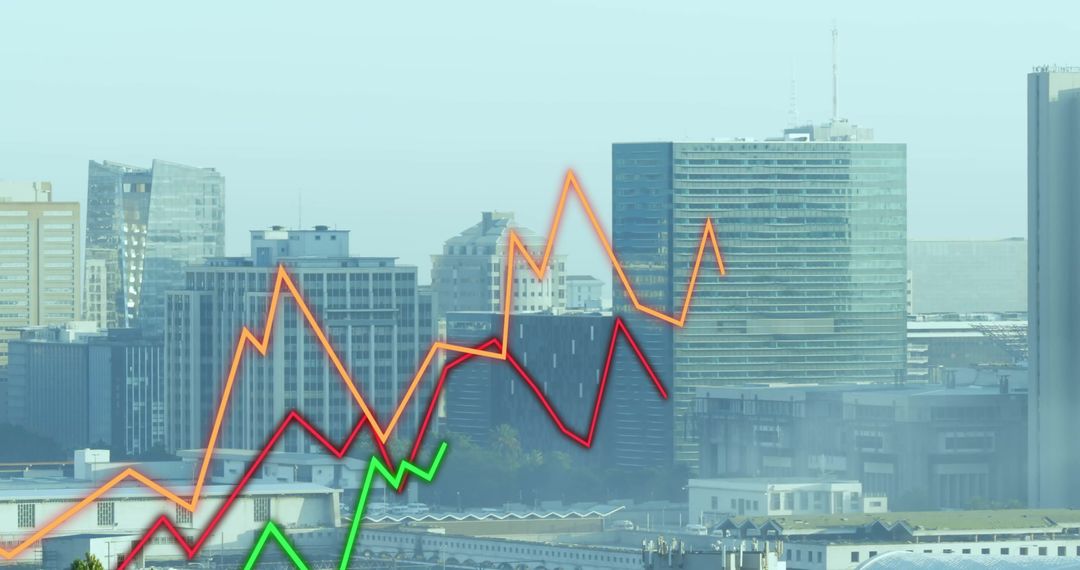
- Projecting Financial Data Over Urban Skyline Showing Rising Market Trends and Analytics
Projecting Financial Data Over Urban Skyline Showing Rising Market Trends and Analytics Image

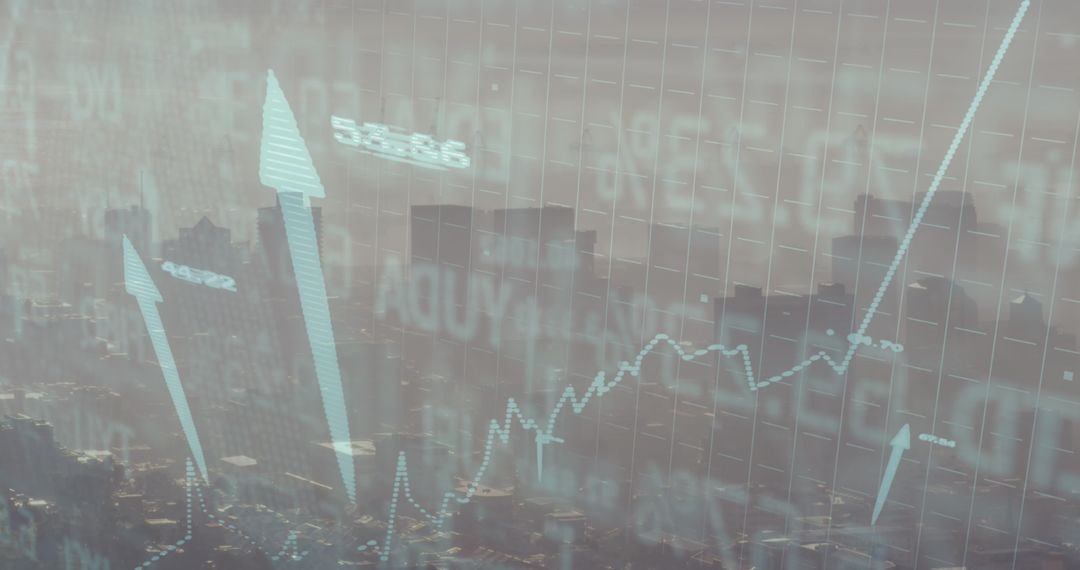
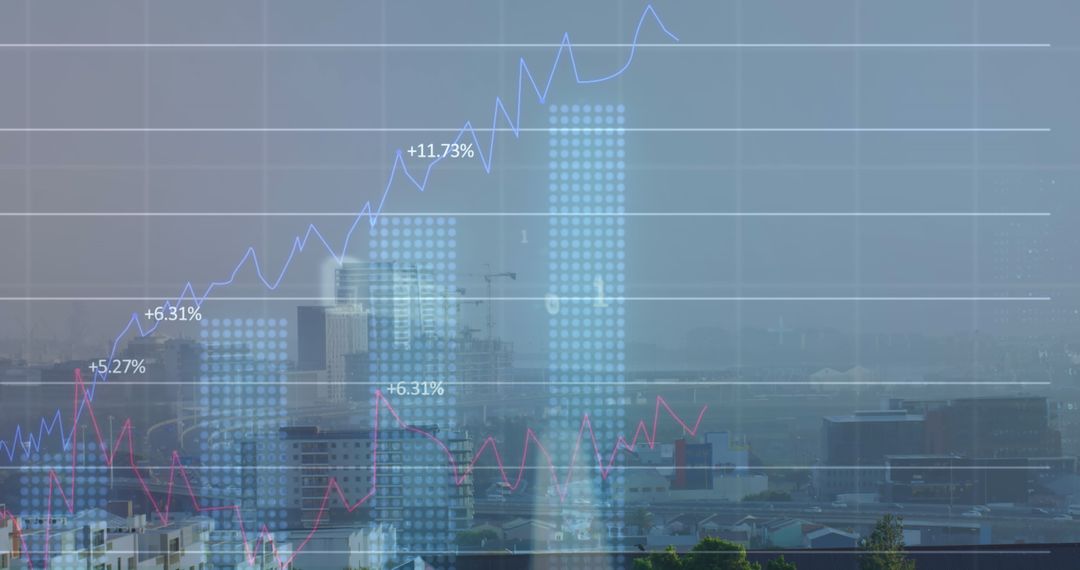
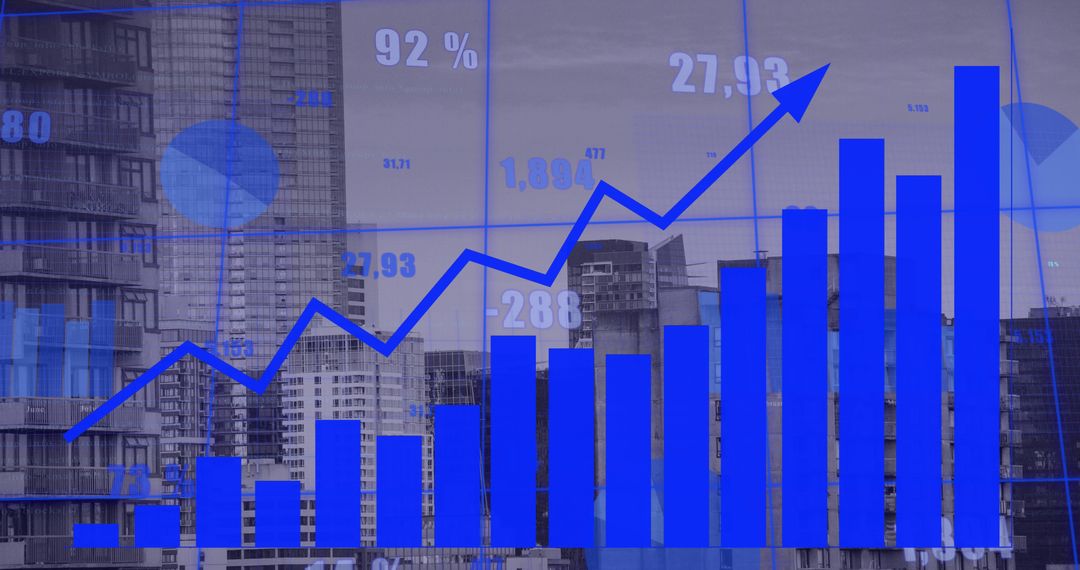
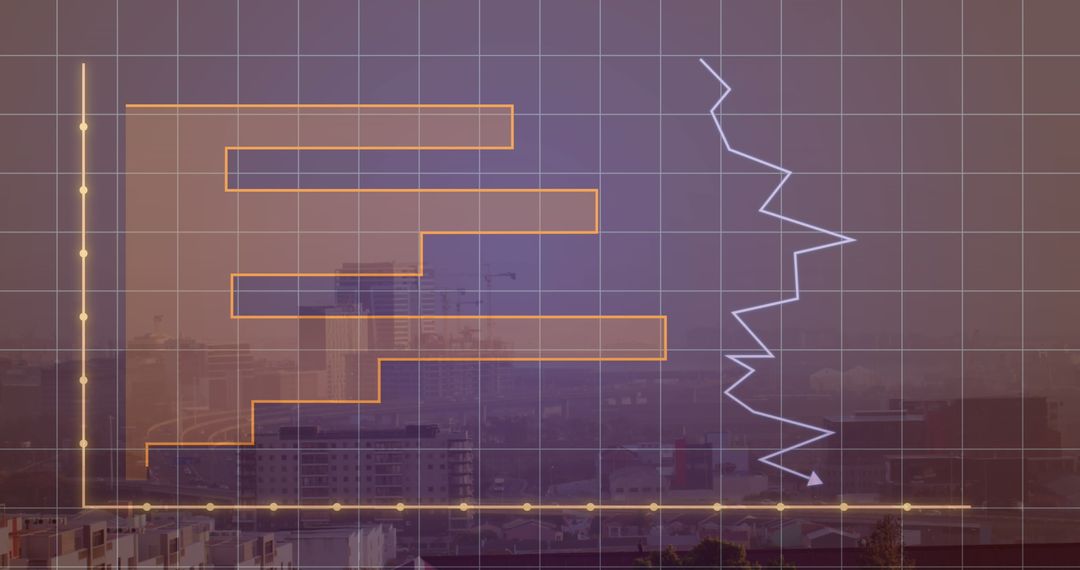
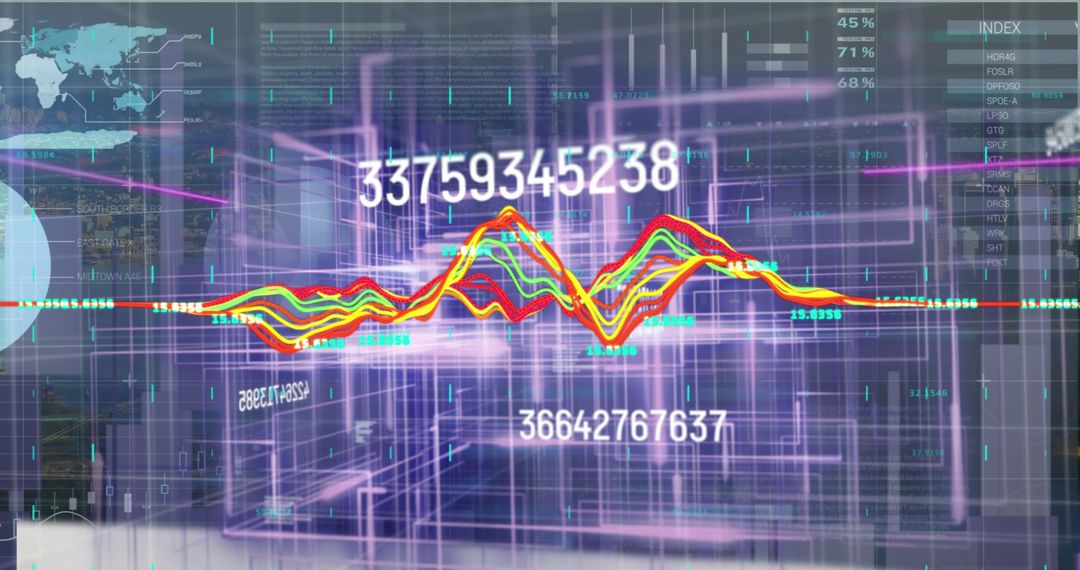
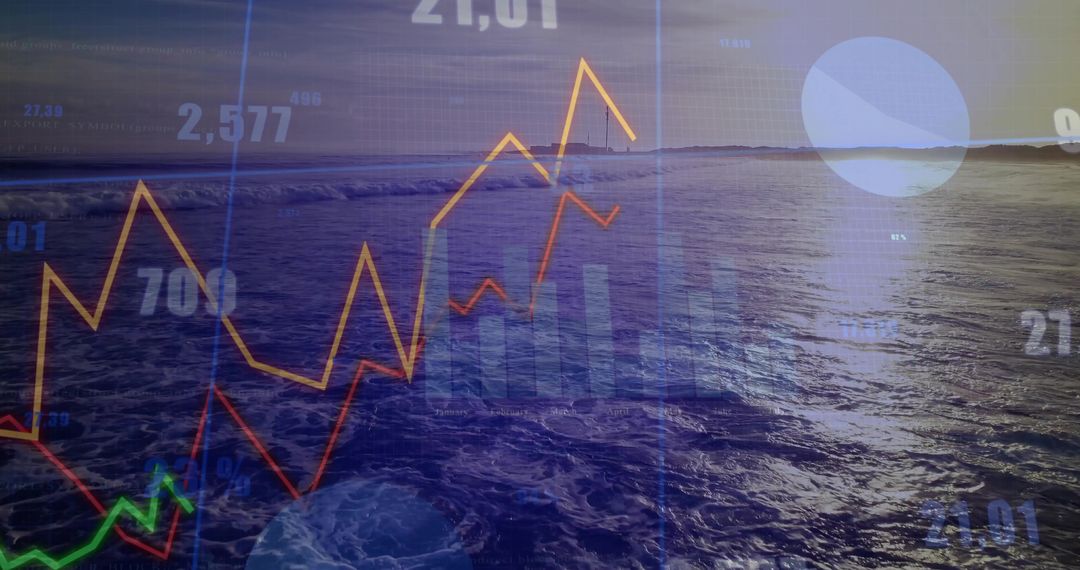
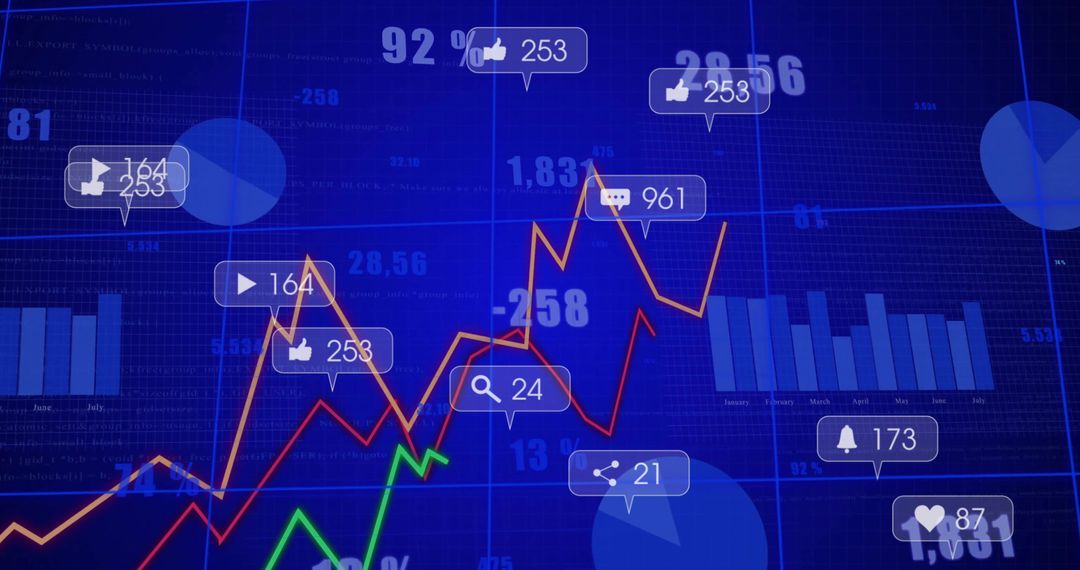
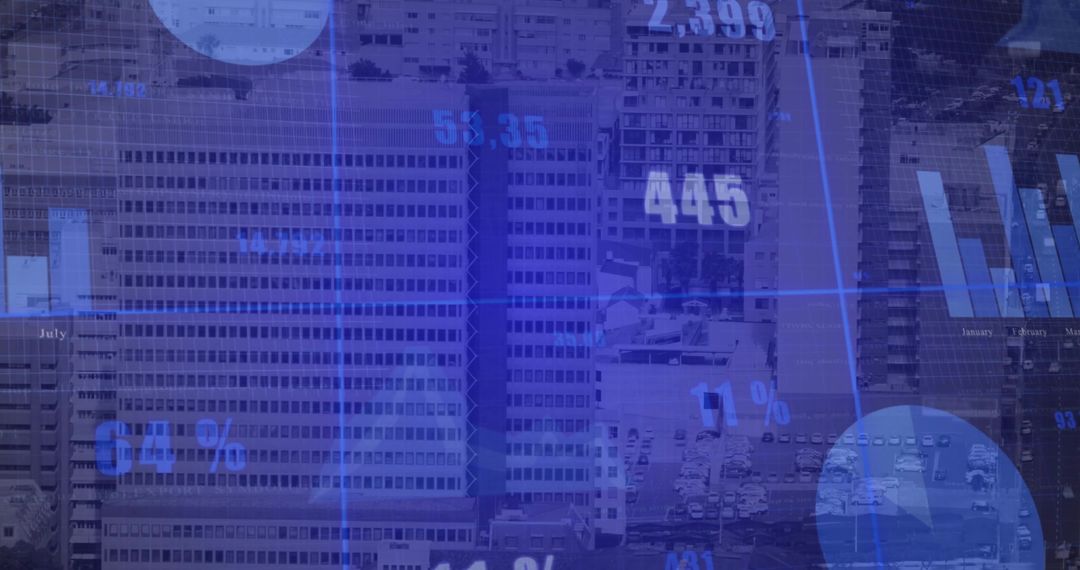
Showing neon line charts, jagged market lines, numeric labels and translucent bar graphs layered over modern high-rise skyline. Featuring cool blue and purple tones with bright orange and green trend lines for clear visual contrast. Balancing urban architecture with digital grid, data points and subtle wireless icons for tech-forward mood. Working well as hero banner, website header, fintech landing page, or background for investment and market analysis content. Suiting presentations, annual reports, pitch decks, social media campaigns and editorial pieces about economy, trading or smart city technology. Providing space for headline copy and logos when cropping for wide or banner formats.
Powered by 


0
downloads
downloads
Tags:
More
Credit Photo
If you would like to credit the Photo, here are some ways you can do so
Text Link
photo Link
<span class="text-link">
<span>
<a target="_blank" href=https://pikwizard.com/photo/projecting-financial-data-over-urban-skyline-showing-rising-market-trends-and-analytics/c1063ff83739d62249e78bc1cd59b769/>PikWizard</a>
</span>
</span>
<span class="image-link">
<span
style="margin: 0 0 20px 0; display: inline-block; vertical-align: middle; width: 100%;"
>
<a
target="_blank"
href="https://pikwizard.com/photo/projecting-financial-data-over-urban-skyline-showing-rising-market-trends-and-analytics/c1063ff83739d62249e78bc1cd59b769/"
style="text-decoration: none; font-size: 10px; margin: 0;"
>
<img src="https://pikwizard.com/pw/medium/c1063ff83739d62249e78bc1cd59b769.jpg" style="margin: 0; width: 100%;" alt="" />
<p style="font-size: 12px; margin: 0;">PikWizard</p>
</a>
</span>
</span>
Free (free of charge)
Free for personal and commercial use.
Author: Creative Art
Similar Free Stock Images

Premium


Premium


Premium


Premium


Premium


Premium


Premium


Premium


Premium


Premium


Premium


Premium


Premium


Premium


Premium


Premium


Premium


Premium


Premium


Premium


Premium


Premium


Premium


Premium