
- Home >
- Stock Photos >
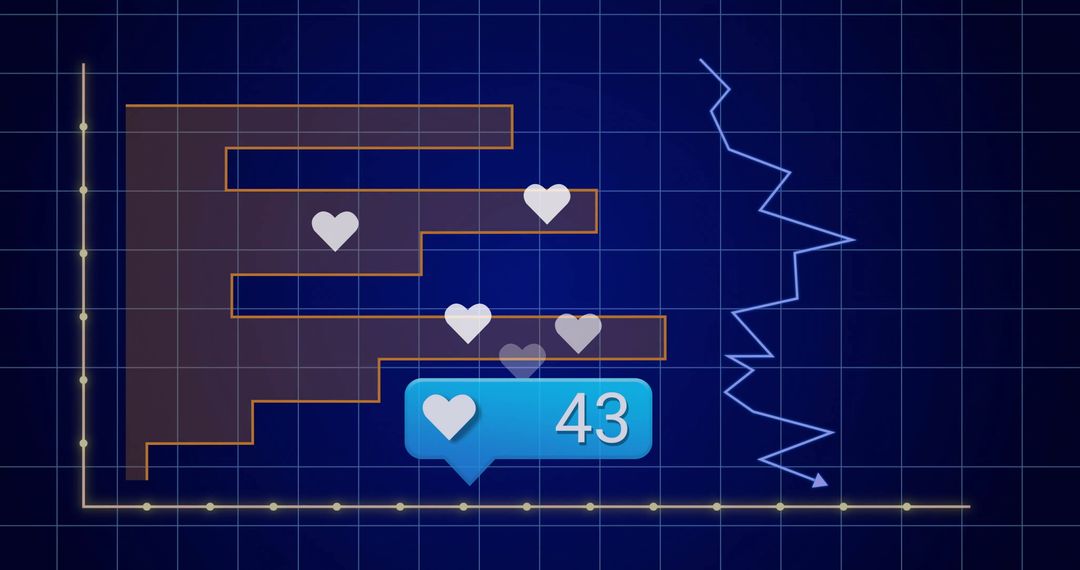
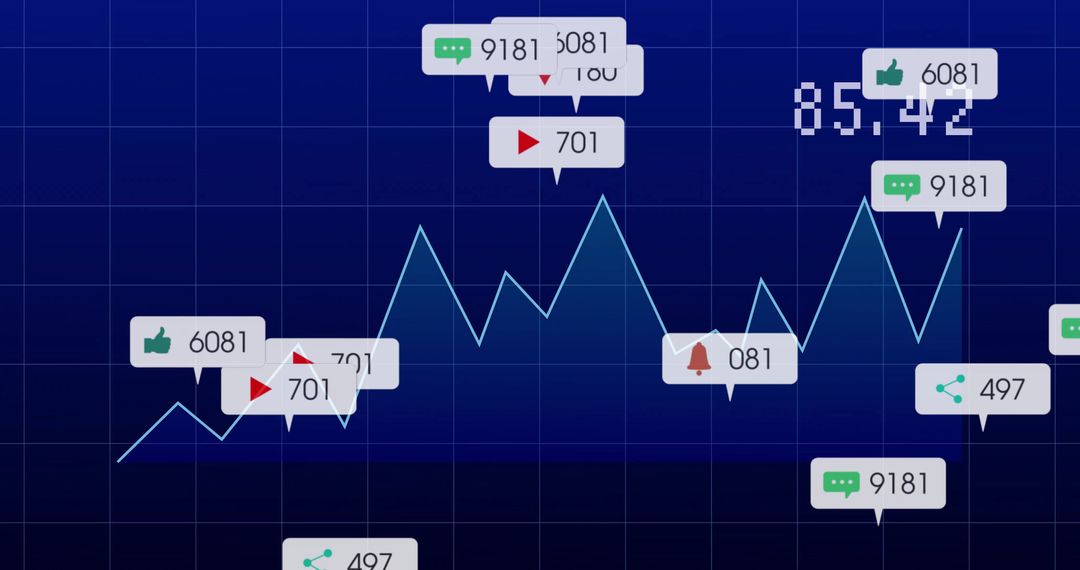
- Purple analytics dashboard with white line graph, tan bars and blue notification badges
Purple analytics dashboard with white line graph, tan bars and blue notification badges Image

Featuring purple gradient background and subtle gridlines, white jagged line graph overlaying tan vertical bars with numeric labels and small markers. Displaying blue rounded badges with chat bubble and heart icons and numeric counts, adding social and notification context. Offering clean modern UI style and high contrast colors, making design suitable for tech, finance, marketing and social media projects. Working well for website hero banners, presentation slides, app mockups, marketing reports, social media analytics and business dashboards. Allowing cropping for header images, thumbnails, backgrounds, or overlaying headlines and data callouts. Providing room for adding logos, custom metrics, color adjustments for brand matching, or headline text.
Powered by  - Get 15% off with code: PIKWIZARD15


0
downloads
downloads
Tags:
More
Credit Photo
If you would like to credit the Photo, here are some ways you can do so
Text Link
photo Link
<span class="text-link">
<span>
<a target="_blank" href=https://pikwizard.com/photo/purple-analytics-dashboard-with-white-line-graph-tan-bars-and-blue-notification-badges/1e1edba1439f7177d6111be4db9095df/>PikWizard</a>
</span>
</span>
<span class="image-link">
<span
style="margin: 0 0 20px 0; display: inline-block; vertical-align: middle; width: 100%;"
>
<a
target="_blank"
href="https://pikwizard.com/photo/purple-analytics-dashboard-with-white-line-graph-tan-bars-and-blue-notification-badges/1e1edba1439f7177d6111be4db9095df/"
style="text-decoration: none; font-size: 10px; margin: 0;"
>
<img src="https://pikwizard.com/pw/medium/1e1edba1439f7177d6111be4db9095df.jpg" style="margin: 0; width: 100%;" alt="" />
<p style="font-size: 12px; margin: 0;">PikWizard</p>
</a>
</span>
</span>
Free (free of charge)
Free for personal and commercial use.
Author: Awesome Content
Similar Free Stock Images

Premium


Premium


Premium


Premium


Premium


Premium


Premium


Premium


Premium


Premium


Premium


Premium


Premium


Premium


Premium


Premium


Premium


Premium


Premium


Premium


Premium


Premium


Premium


Premium

