- Home >
- Stock Photos >
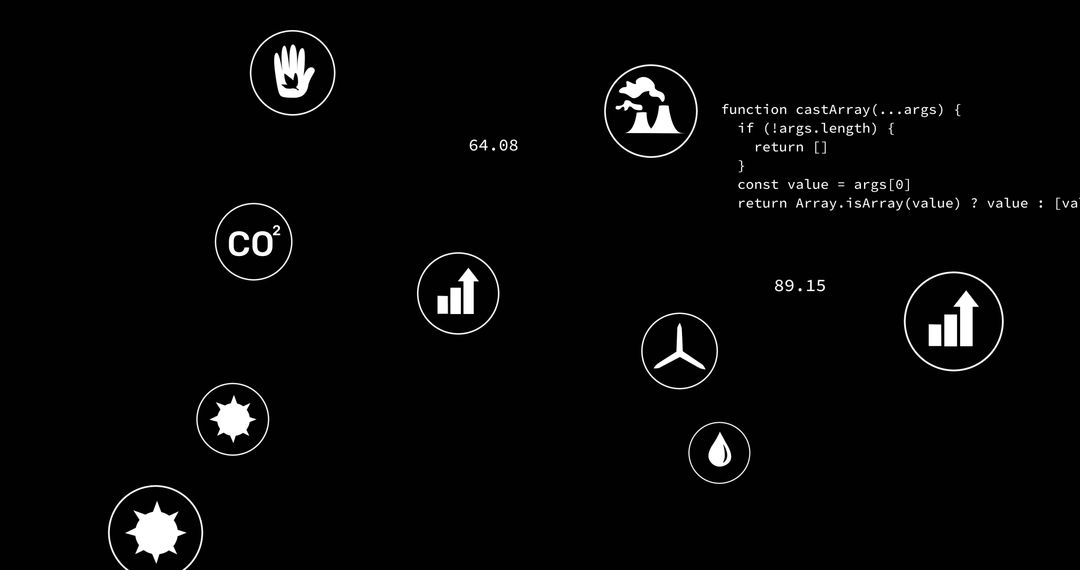
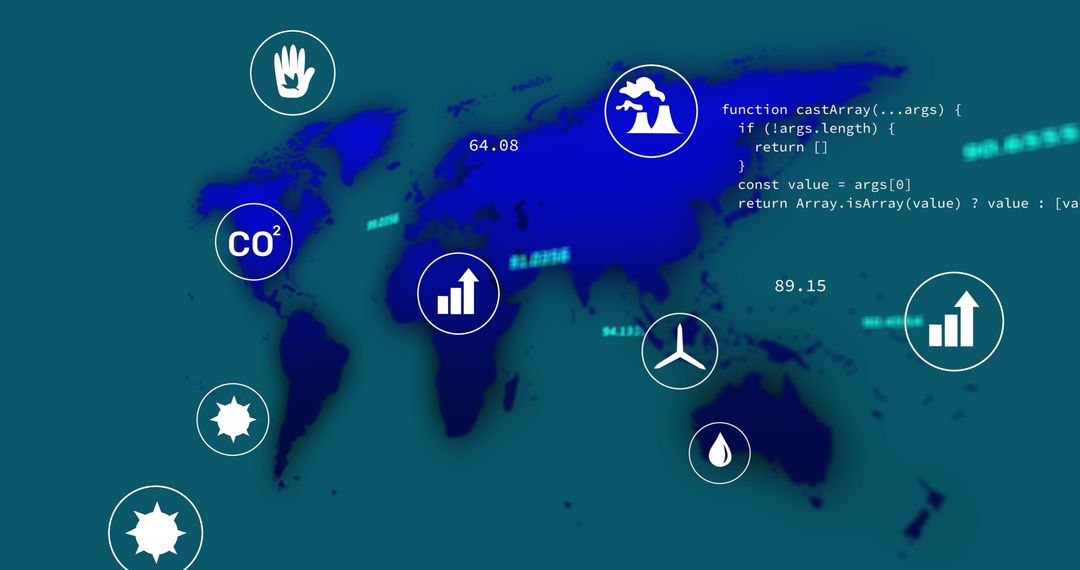
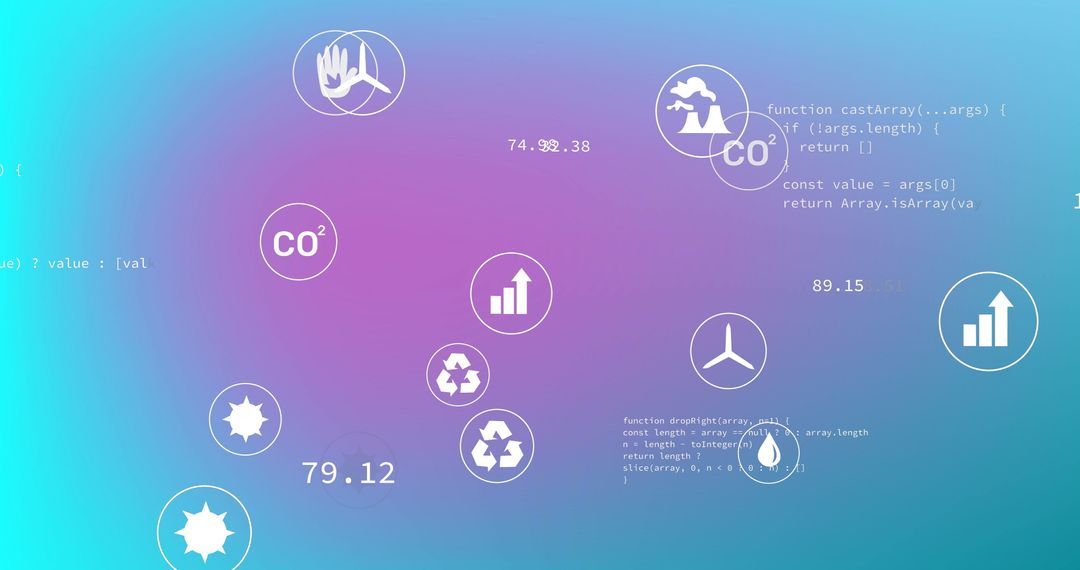
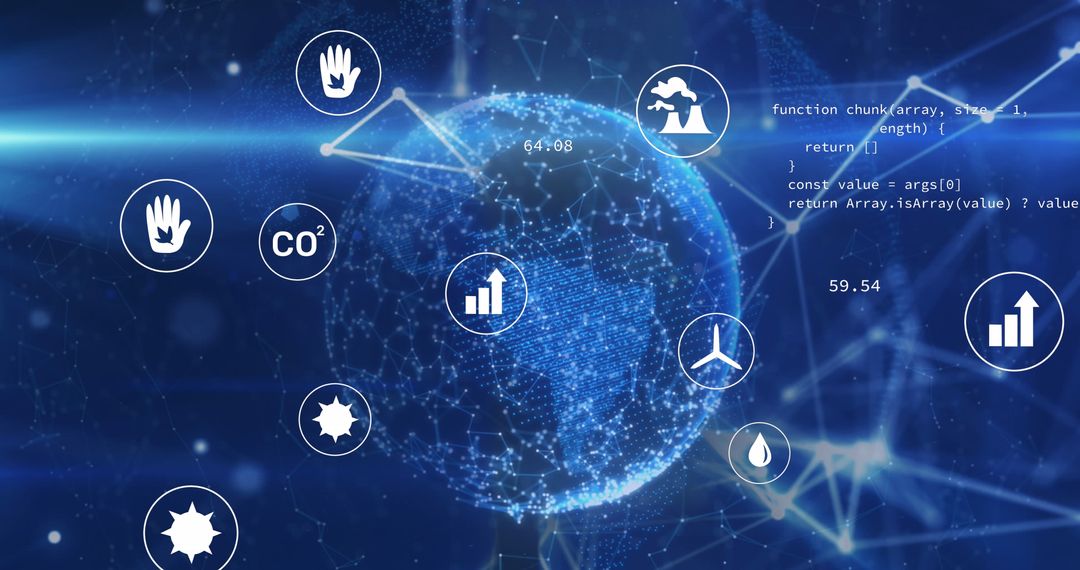
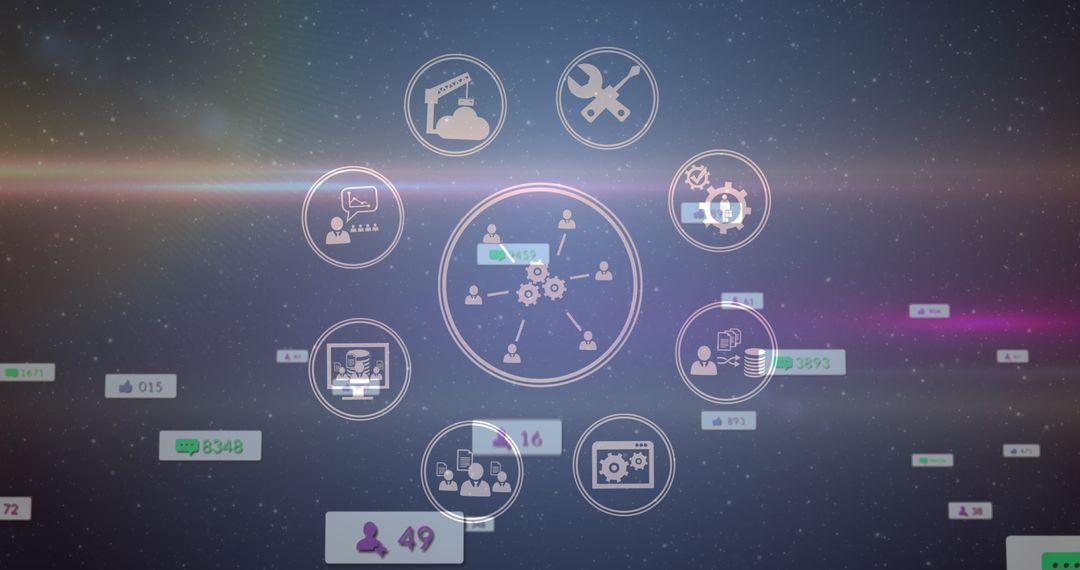
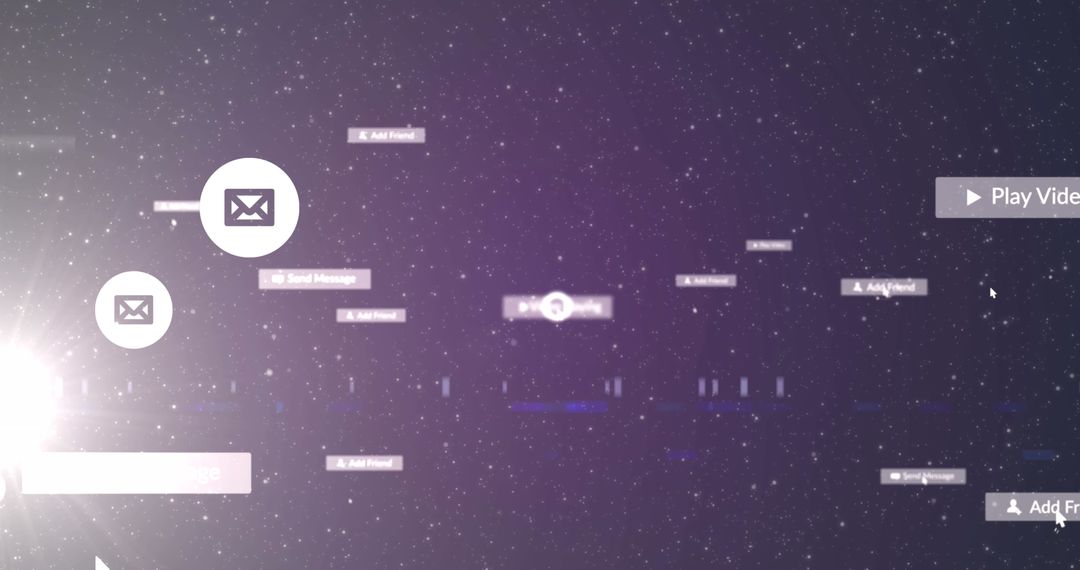
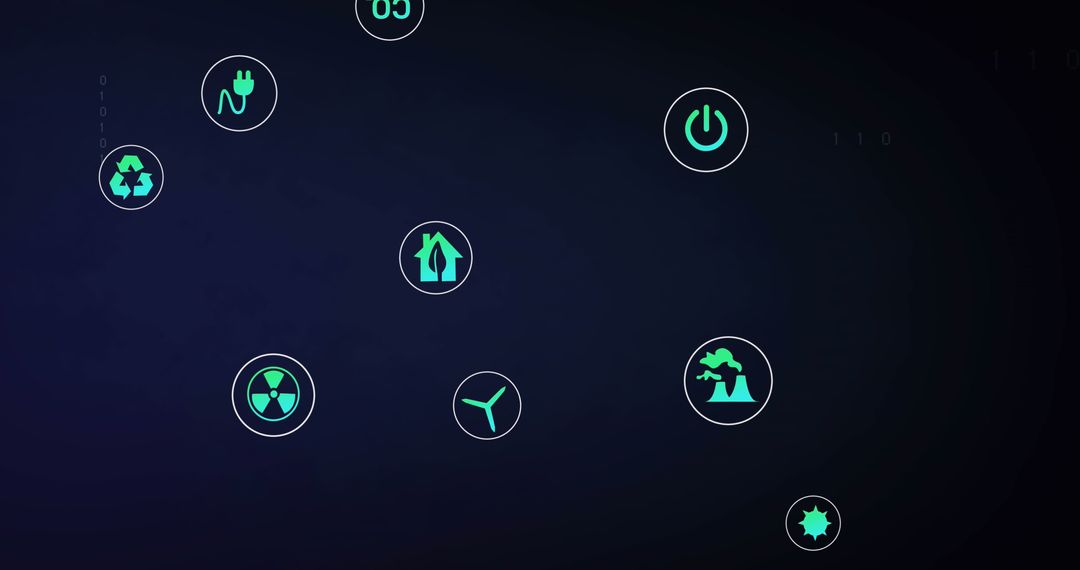
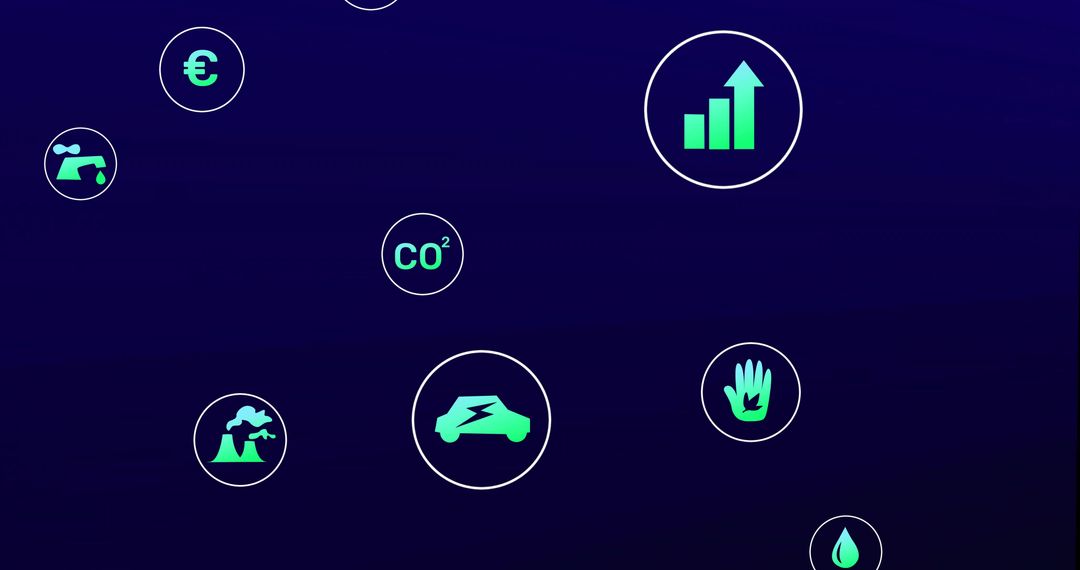
- Purple data dashboard showing CO2, emissions and energy icons with analytics readouts
Purple data dashboard showing CO2, emissions and energy icons with analytics readouts Image
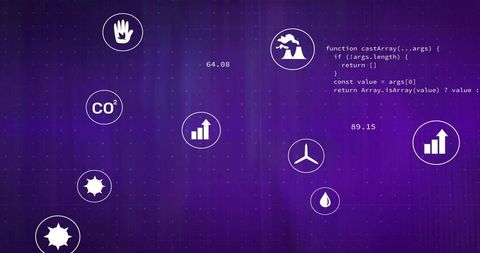
Showing purple gradient dashboard with circular eco and data icons, numeric readouts and code snippet overlay. Featuring CO2 symbol, bar chart growth icons, wind turbine, water droplet, sun and industrial plume icons that imply carbon and energy metrics. Including small code snippet and floating numeric values for tech and developer appeal. Working well for sustainability reports, environmental technology presentations, web and app UI mockups, blog posts about carbon analytics, renewable energy dashboards and corporate ESG materials. Providing space for overlaying headline text, logo or call to action. Being easily adaptable for color changes, cropping and adding localized data overlays.
Powered by  - Get 15% off with code: PIKWIZARD15


0
downloads
downloads
Tags:
More
Credit Photo
If you would like to credit the Photo, here are some ways you can do so
Text Link
photo Link
<span class="text-link">
<span>
<a target="_blank" href=https://pikwizard.com/photo/purple-data-dashboard-showing-co2-emissions-and-energy-icons-with-analytics-readouts/b179512dc3438b2c4831b97a68c40cb9/>PikWizard</a>
</span>
</span>
<span class="image-link">
<span
style="margin: 0 0 20px 0; display: inline-block; vertical-align: middle; width: 100%;"
>
<a
target="_blank"
href="https://pikwizard.com/photo/purple-data-dashboard-showing-co2-emissions-and-energy-icons-with-analytics-readouts/b179512dc3438b2c4831b97a68c40cb9/"
style="text-decoration: none; font-size: 10px; margin: 0;"
>
<img src="https://pikwizard.com/pw/medium/b179512dc3438b2c4831b97a68c40cb9.jpg" style="margin: 0; width: 100%;" alt="" />
<p style="font-size: 12px; margin: 0;">PikWizard</p>
</a>
</span>
</span>
Free (free of charge)
Free for personal and commercial use.
Author: Authentic Images
Similar Free Stock Images

Premium


Premium


Premium


Premium


Premium


Premium


Premium


Premium


Premium


Premium


Premium


Premium


Premium


Premium


Premium


Premium


Premium


Premium


Premium


Premium


Premium


Premium


Premium


Premium