- Home >
- Stock Photos >
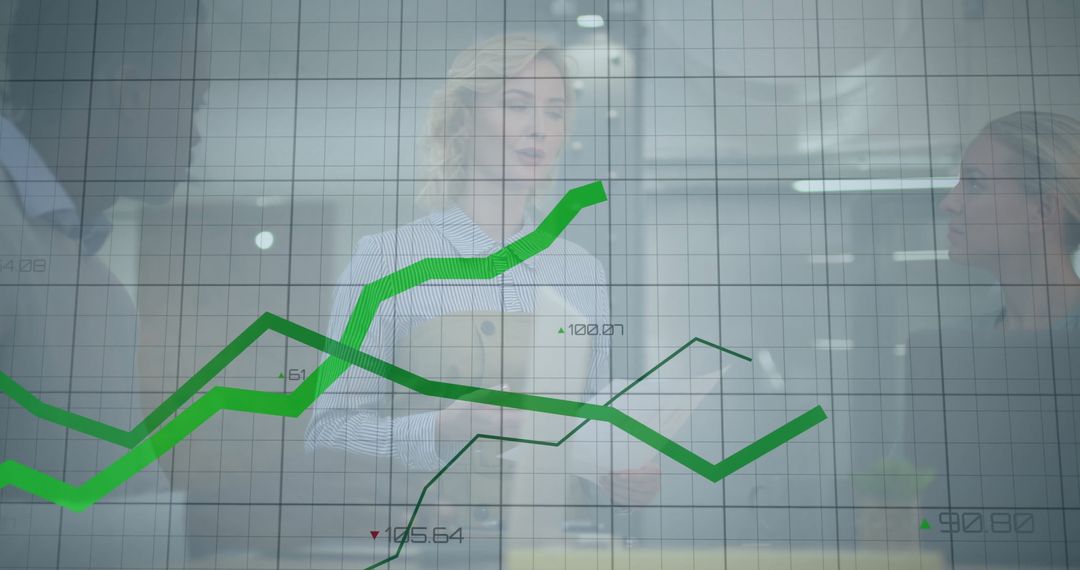
- Red-haired woman typing on laptop with green data visualization overlay in home office
Red-haired woman typing on laptop with green data visualization overlay in home office Image
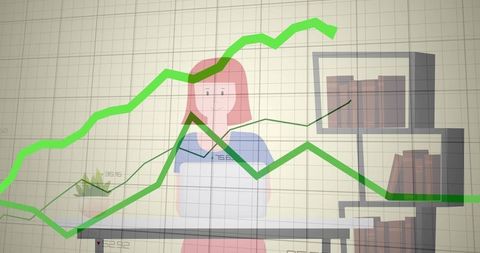
Showing red-haired woman typing on laptop with translucent green line graphs and grid overlay. Minimal home office scene featuring laptop, shelves with books, small succulent, clean desk. Visual focus on data visualization, analytics, productivity, and remote work trends. Suitable for use in business blog posts, analytics reports, finance presentations, online course thumbnails, marketing banners, and social media ads. Working well as header graphic or background for websites and slide decks thanks to clean composition and ample negative space. Color palette offering soft neutral tones with vivid green accents for charts.
Powered by  - Get 15% off with code: PIKWIZARD15


0
downloads
downloads
Tags:
More
Credit Photo
If you would like to credit the Photo, here are some ways you can do so
Text Link
photo Link
<span class="text-link">
<span>
<a target="_blank" href=https://pikwizard.com/photo/red-haired-woman-typing-on-laptop-with-green-data-visualization-overlay-in-home-office/19ca21d89c6c465921875eb9ef08b2c1/>PikWizard</a>
</span>
</span>
<span class="image-link">
<span
style="margin: 0 0 20px 0; display: inline-block; vertical-align: middle; width: 100%;"
>
<a
target="_blank"
href="https://pikwizard.com/photo/red-haired-woman-typing-on-laptop-with-green-data-visualization-overlay-in-home-office/19ca21d89c6c465921875eb9ef08b2c1/"
style="text-decoration: none; font-size: 10px; margin: 0;"
>
<img src="https://pikwizard.com/pw/medium/19ca21d89c6c465921875eb9ef08b2c1.jpg" style="margin: 0; width: 100%;" alt="" />
<p style="font-size: 12px; margin: 0;">PikWizard</p>
</a>
</span>
</span>
Free (free of charge)
Free for personal and commercial use.
Author: Creative Art
Similar Free Stock Images

Premium


Premium


Premium


Premium


Premium


Premium


Premium


Premium


Premium


Premium


Premium


Premium


Premium


Premium


Premium


Premium


Premium


Premium


Premium


Premium


Premium


Premium


Premium


Premium