- Home >
- Stock Photos >
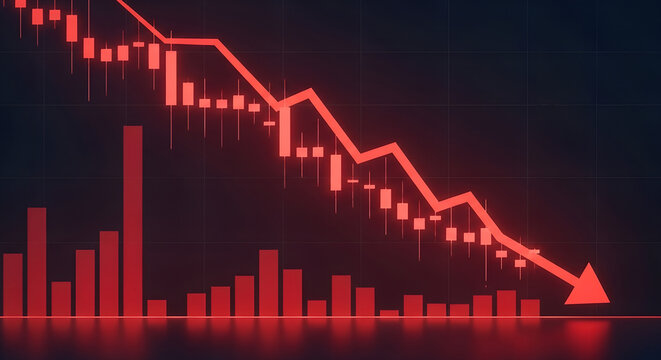
- Red Line Graph Illustrating Market Decline on Financial Chart
Red Line Graph Illustrating Market Decline on Financial Chart Image

This illustration vividly conveys a financial market downturn, highlighted by a prominent red line graph. Ideal for presentations on economic challenges, stock market performance, and investment analysis, it serves as an effective visual for financial reports, articles, and educational materials exploring market volatility and economic fluctuations.
Powered by 


2
downloads
downloads
Tags:
More
Credit Photo
If you would like to credit the Photo, here are some ways you can do so
Text Link
photo Link
<span class="text-link">
<span>
<a target="_blank" href=https://pikwizard.com/photo/red-line-graph-illustrating-market-decline-on-financial-chart/1a97e67dc965978b16bbc344e6682b83/>PikWizard</a>
</span>
</span>
<span class="image-link">
<span
style="margin: 0 0 20px 0; display: inline-block; vertical-align: middle; width: 100%;"
>
<a
target="_blank"
href="https://pikwizard.com/photo/red-line-graph-illustrating-market-decline-on-financial-chart/1a97e67dc965978b16bbc344e6682b83/"
style="text-decoration: none; font-size: 10px; margin: 0;"
>
<img src="https://pikwizard.com/pw/medium/1a97e67dc965978b16bbc344e6682b83.jpg" style="margin: 0; width: 100%;" alt="" />
<p style="font-size: 12px; margin: 0;">PikWizard</p>
</a>
</span>
</span>
Free (free of charge)
Free for personal and commercial use.
Author: Authentic Images
Similar Free Stock Images

Premium


Premium


Premium


Premium


Premium


Premium


Premium


Premium


Premium


Premium


Premium


Premium


Premium


Premium


Premium


Premium


Premium


Premium


Premium


Premium


Premium


Premium


Premium


Premium


Premium