- Home >
- Stock Photos >
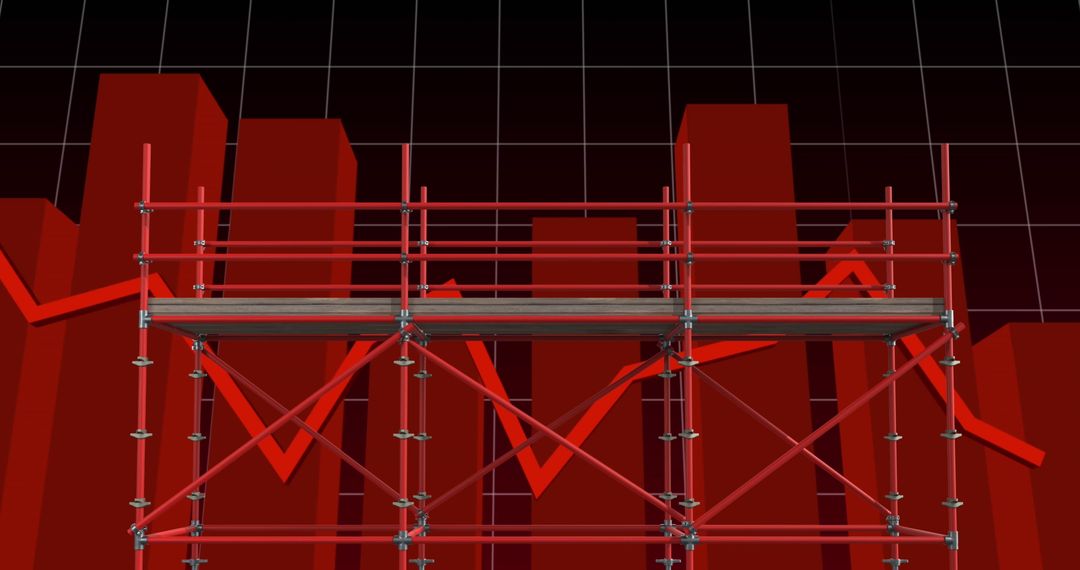
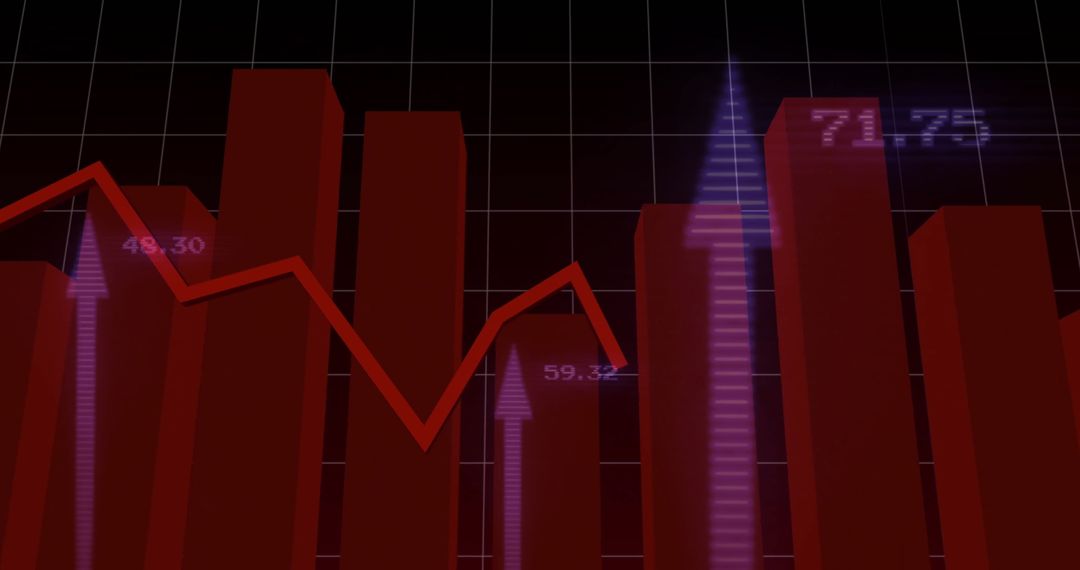
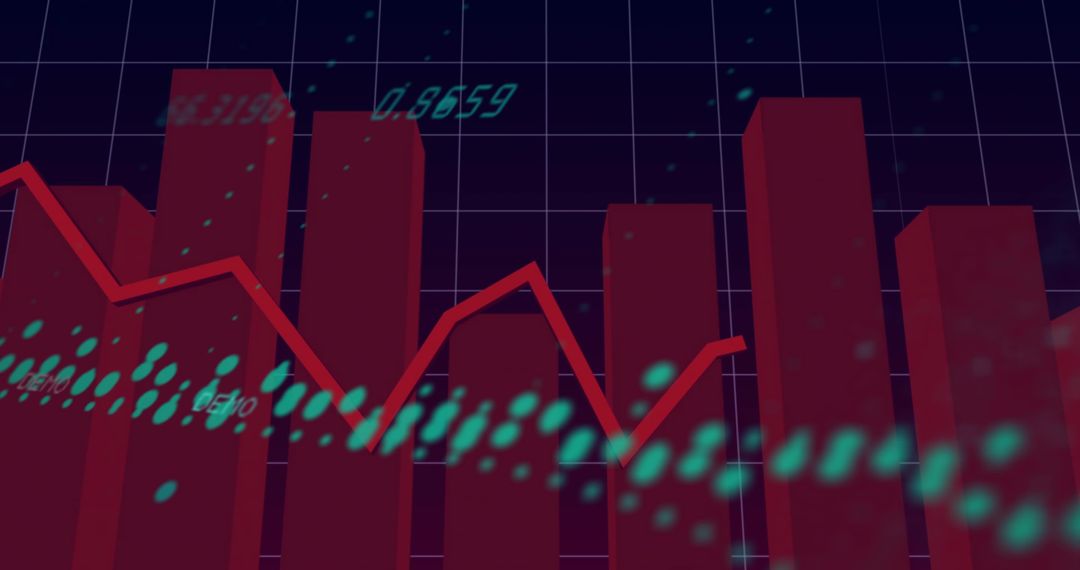
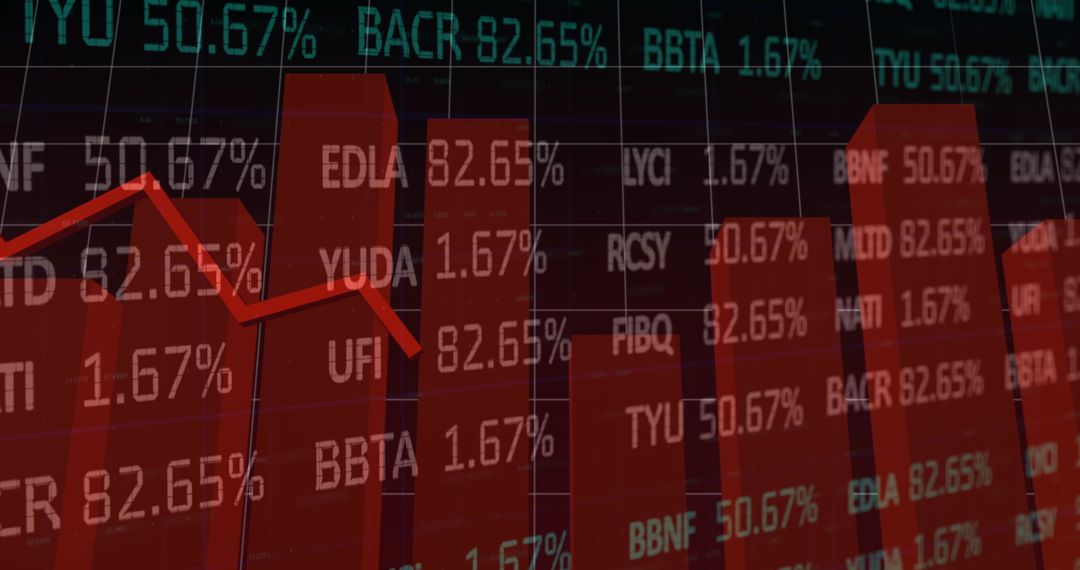
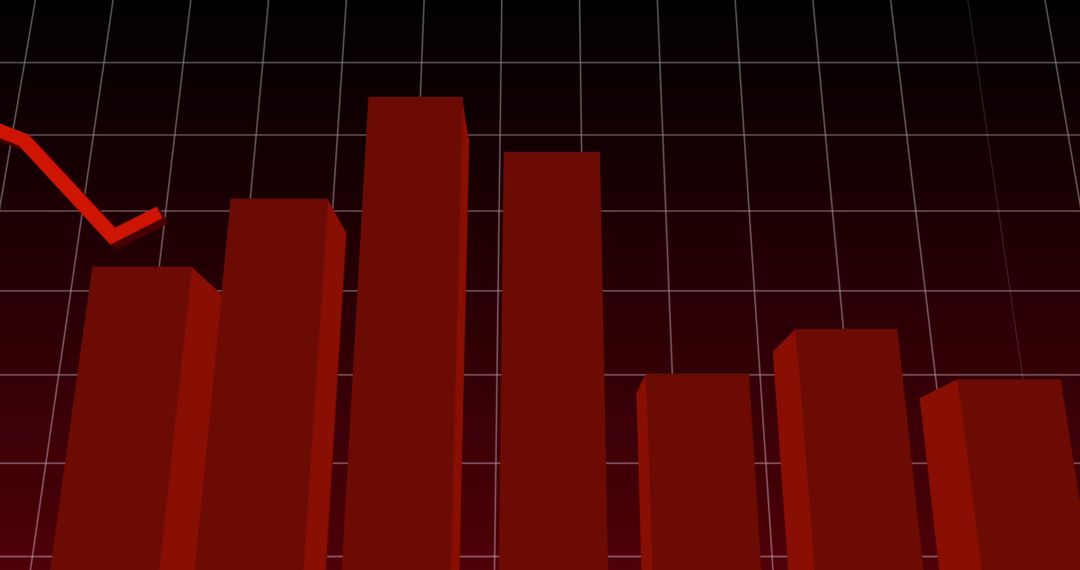
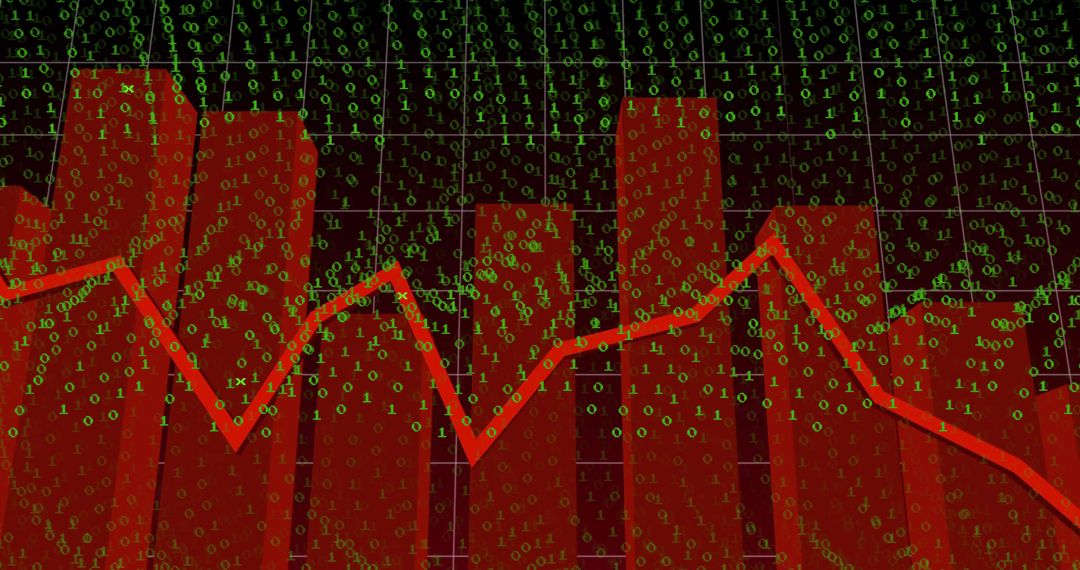
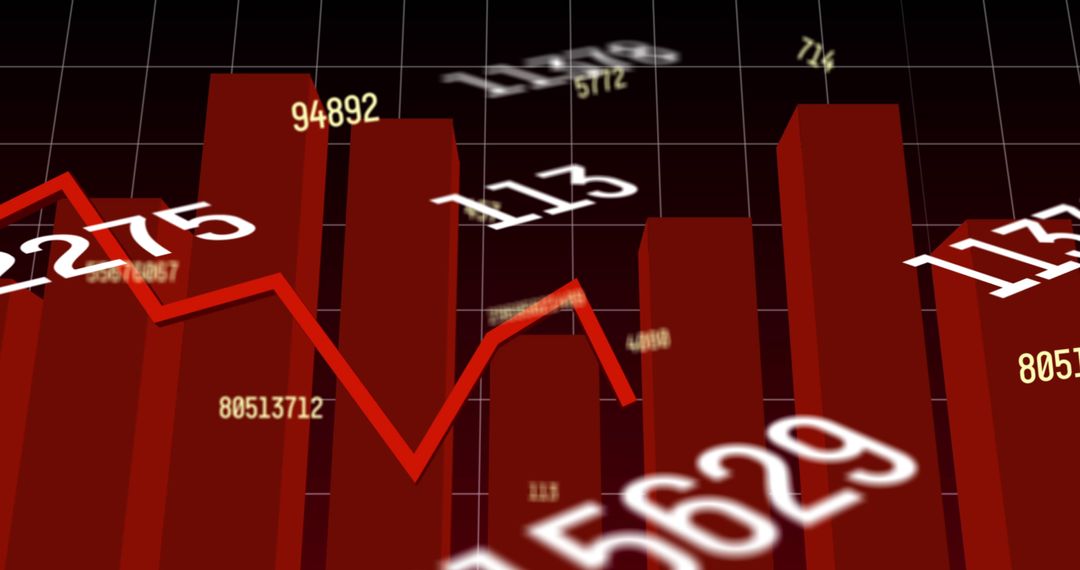
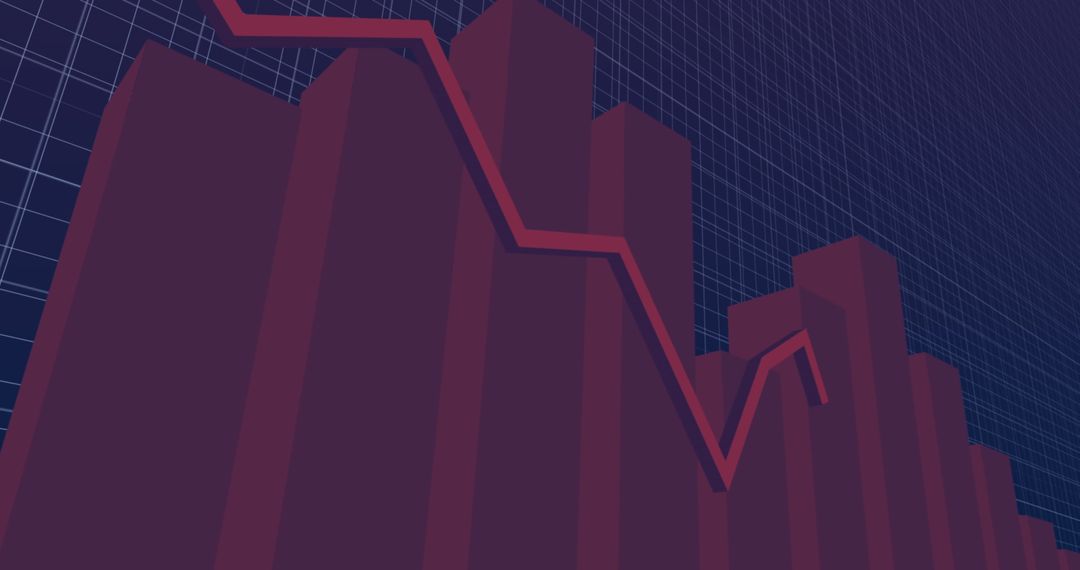
- Red Market Downtrend Showing 3D Bar Chart with Jagged Line and Glowing BUY Letters
Red Market Downtrend Showing 3D Bar Chart with Jagged Line and Glowing BUY Letters Image

Dark red 3D bar chart with jagged descending line and scattered glowing BUY letters, conveying market decline and selling pressure. Serving well for business presentations, financial reports, market analysis articles, investor alerts, trading blog headlines, and economic downturn features. Designers using visual for website banners, social media posts, editorial spreads, slide decks, and risk management collateral; allowing color swaps, overlaying numerical data, and adding headline text. Eliciting urgency and concern while reinforcing themes of volatility, loss, and bearish sentiment.
Powered by  - Get 15% off with code: PIKWIZARD15


0
downloads
downloads
Tags:
More
Credit Photo
If you would like to credit the Photo, here are some ways you can do so
Text Link
photo Link
<span class="text-link">
<span>
<a target="_blank" href=https://pikwizard.com/photo/red-market-downtrend-showing-3d-bar-chart-with-jagged-line-and-glowing-buy-letters/8978105fa2d99fa9fa02e3be8d492c20/>PikWizard</a>
</span>
</span>
<span class="image-link">
<span
style="margin: 0 0 20px 0; display: inline-block; vertical-align: middle; width: 100%;"
>
<a
target="_blank"
href="https://pikwizard.com/photo/red-market-downtrend-showing-3d-bar-chart-with-jagged-line-and-glowing-buy-letters/8978105fa2d99fa9fa02e3be8d492c20/"
style="text-decoration: none; font-size: 10px; margin: 0;"
>
<img src="https://pikwizard.com/pw/medium/8978105fa2d99fa9fa02e3be8d492c20.jpg" style="margin: 0; width: 100%;" alt="" />
<p style="font-size: 12px; margin: 0;">PikWizard</p>
</a>
</span>
</span>
Free (free of charge)
Free for personal and commercial use.
Author: People Creations
Similar Free Stock Images

Premium


Premium


Premium


Premium


Premium


Premium


Premium


Premium


Premium


Premium


Premium


Premium


Premium


Premium


Premium


Premium


Premium


Premium


Premium


Premium


Premium


Premium


Premium


Premium