- Home >
- Stock Photos >
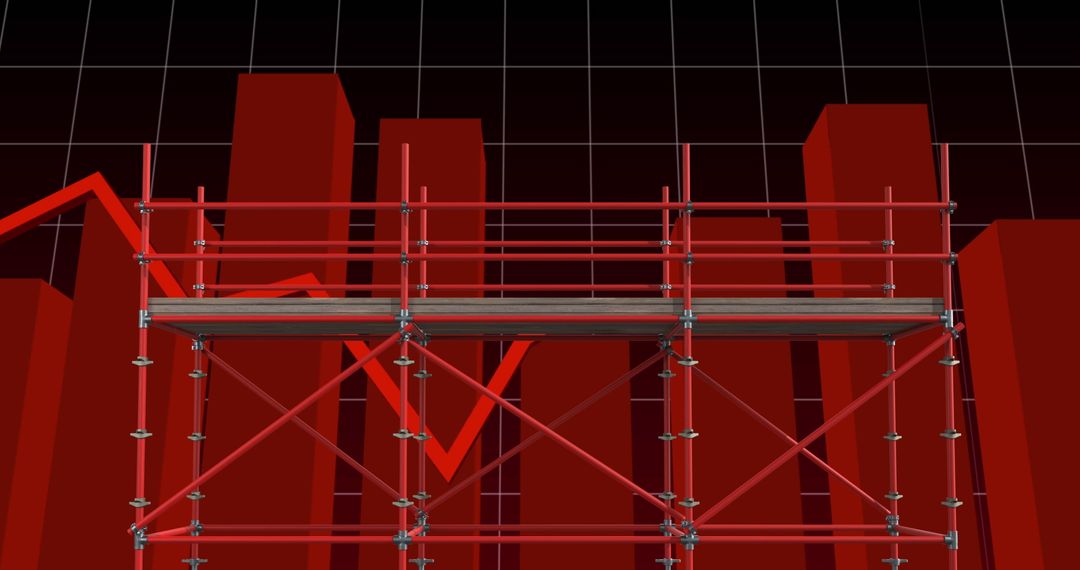
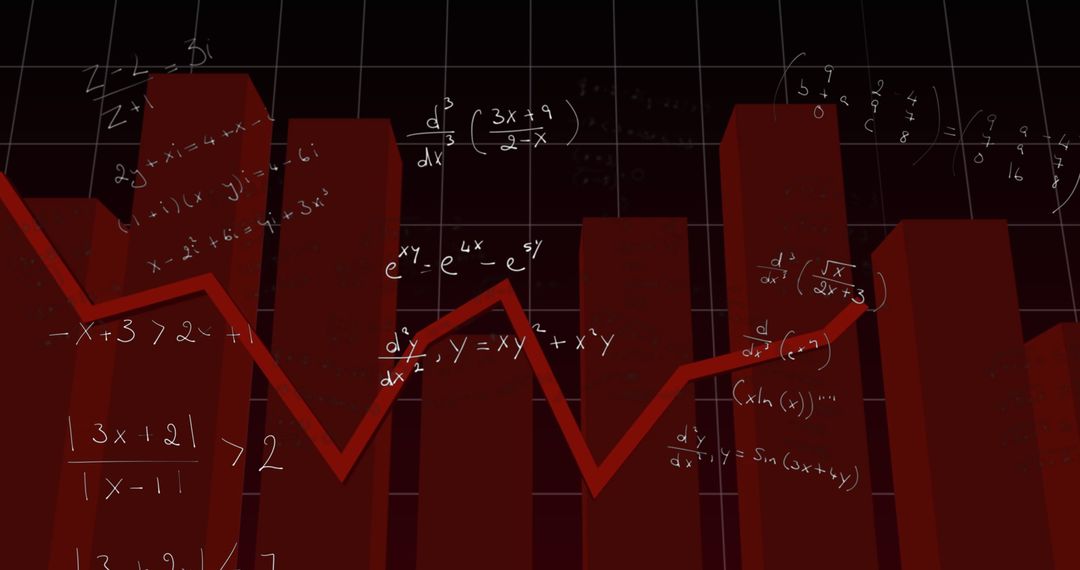
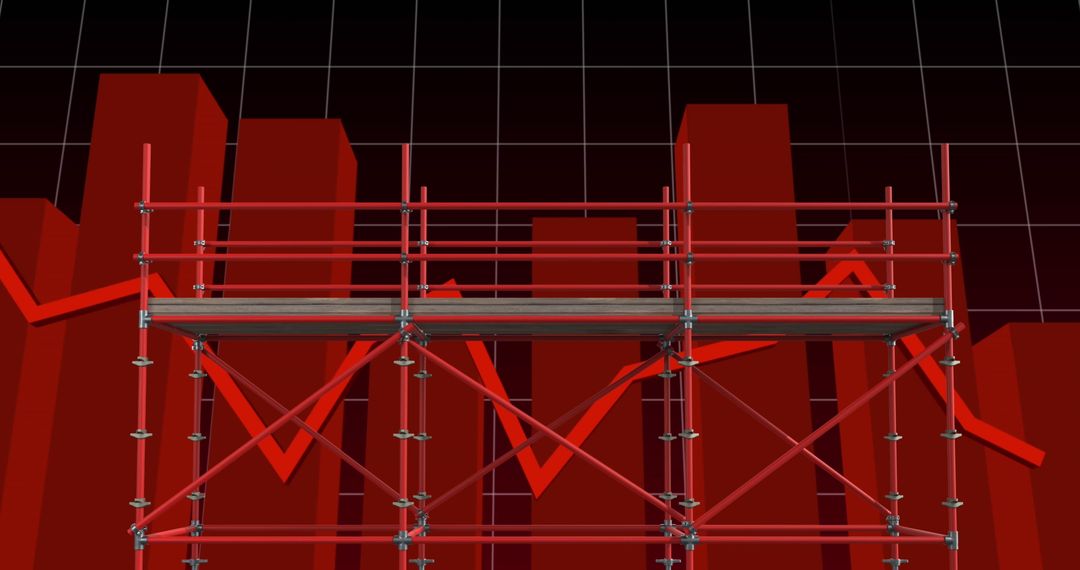
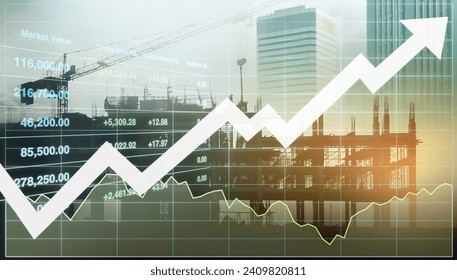
- Red Scaffolding Against Rising Graph Background
Red Scaffolding Against Rising Graph Background Image

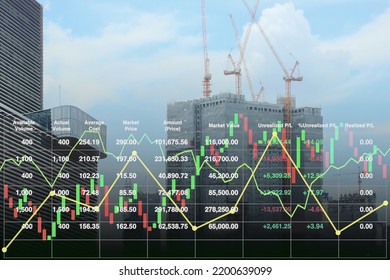
Red scaffolding stands before a large graphic chart with upward trends, representing financial growth and development. Suitable for illustrating themes about construction, industrial expansion, data analysis, and business progress. Perfect for business presentations, economic reports, and digital marketing materials celebrating success and advancement.
Powered by  - Get 15% off with code: PIKWIZARD15


2
downloads
downloads
Tags:
More
Credit Photo
If you would like to credit the Photo, here are some ways you can do so
Text Link
photo Link
<span class="text-link">
<span>
<a target="_blank" href=https://pikwizard.com/photo/red-scaffolding-against-rising-graph-background/873012c0cec15abd63b8d2364c24964d/>PikWizard</a>
</span>
</span>
<span class="image-link">
<span
style="margin: 0 0 20px 0; display: inline-block; vertical-align: middle; width: 100%;"
>
<a
target="_blank"
href="https://pikwizard.com/photo/red-scaffolding-against-rising-graph-background/873012c0cec15abd63b8d2364c24964d/"
style="text-decoration: none; font-size: 10px; margin: 0;"
>
<img src="https://pikwizard.com/pw/medium/873012c0cec15abd63b8d2364c24964d.jpg" style="margin: 0; width: 100%;" alt="" />
<p style="font-size: 12px; margin: 0;">PikWizard</p>
</a>
</span>
</span>
Free (free of charge)
Free for personal and commercial use.
Author: People Creations
Similar Free Stock Images

Premium