- Home >
- Stock Photos >
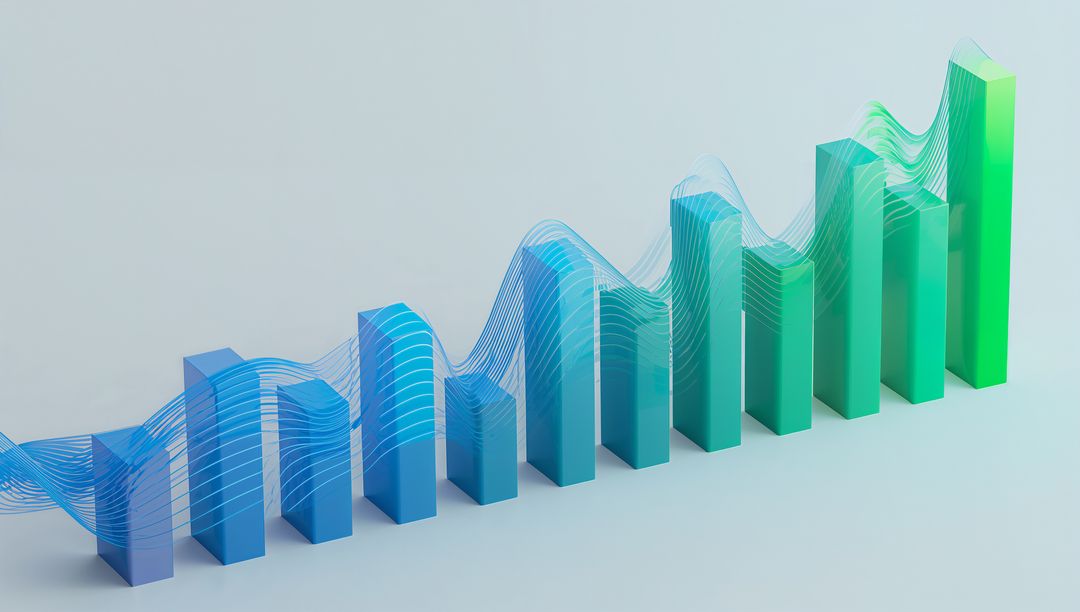
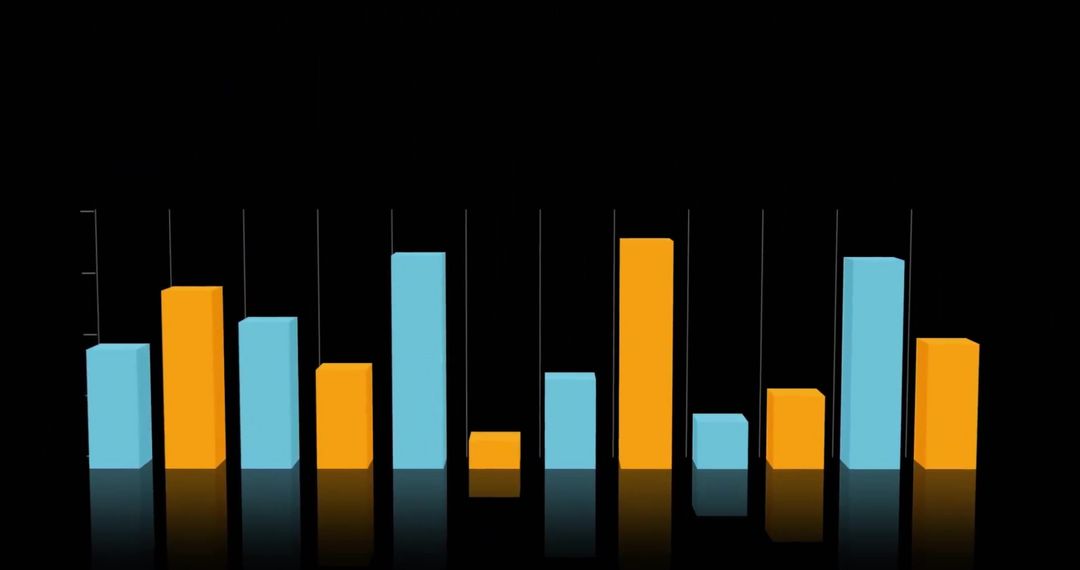
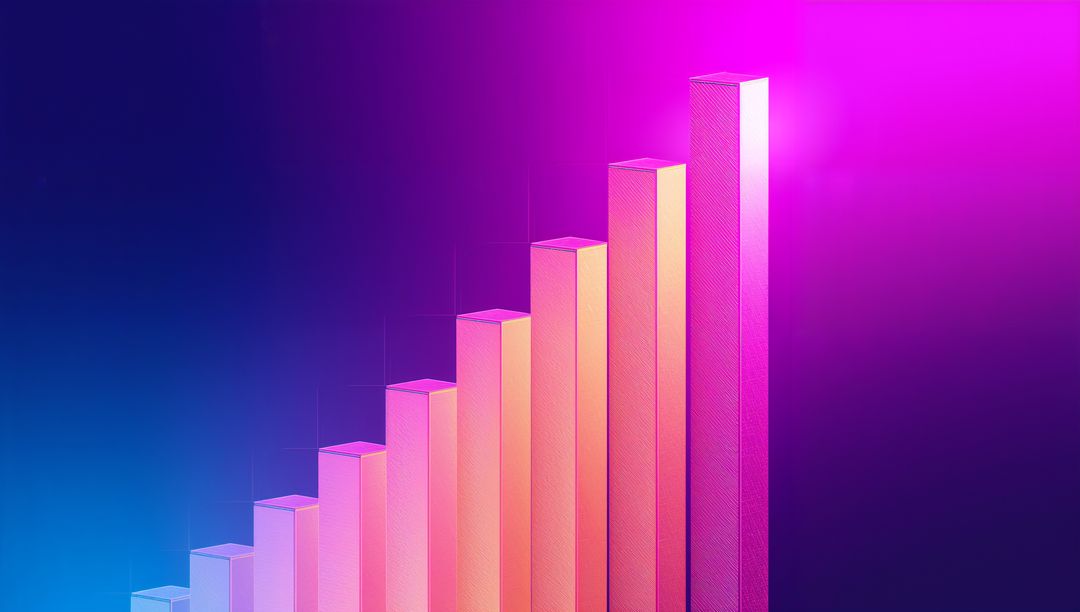
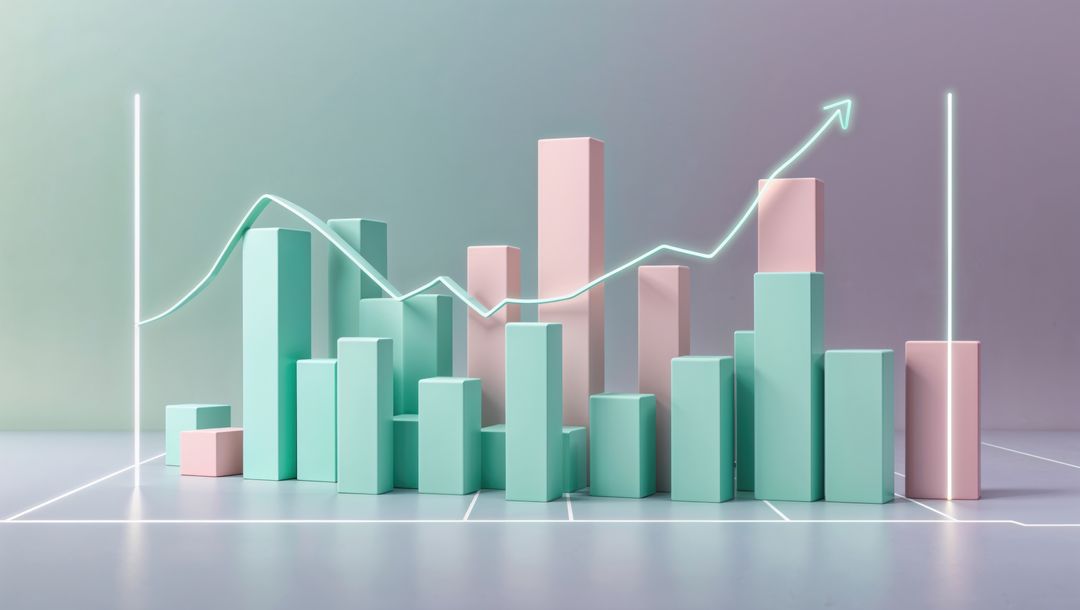
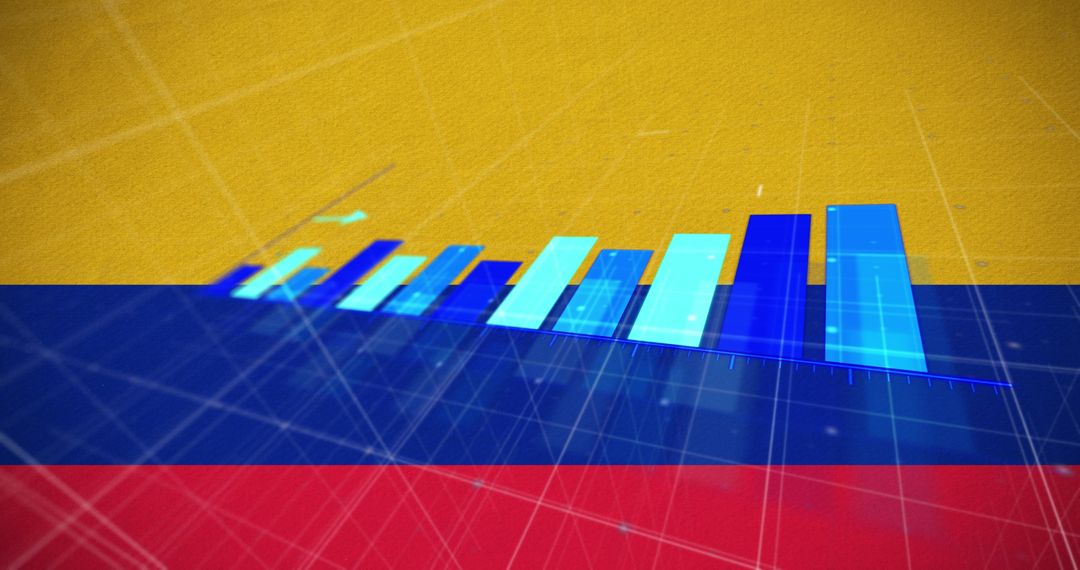
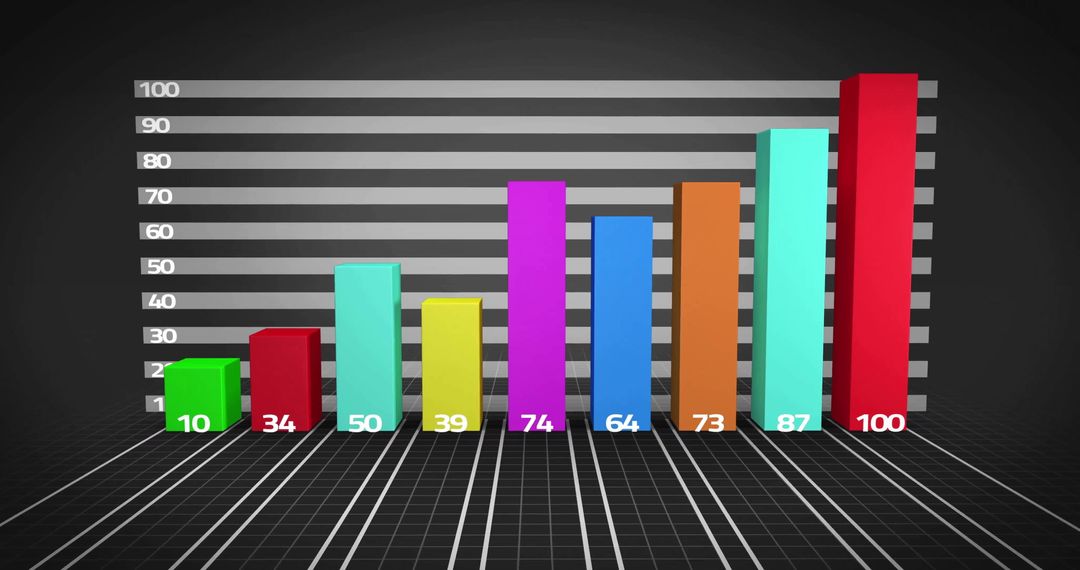
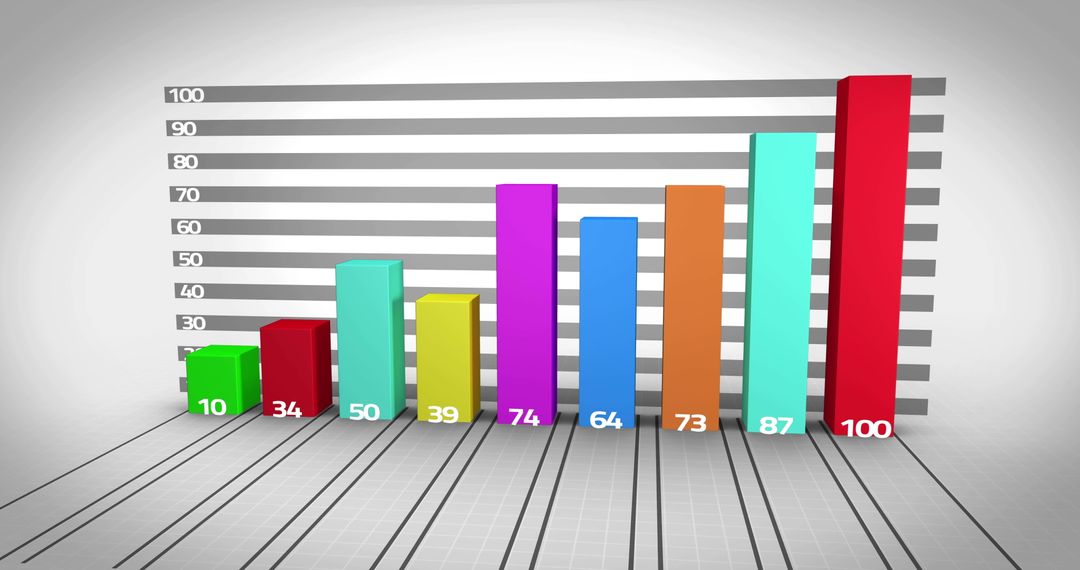
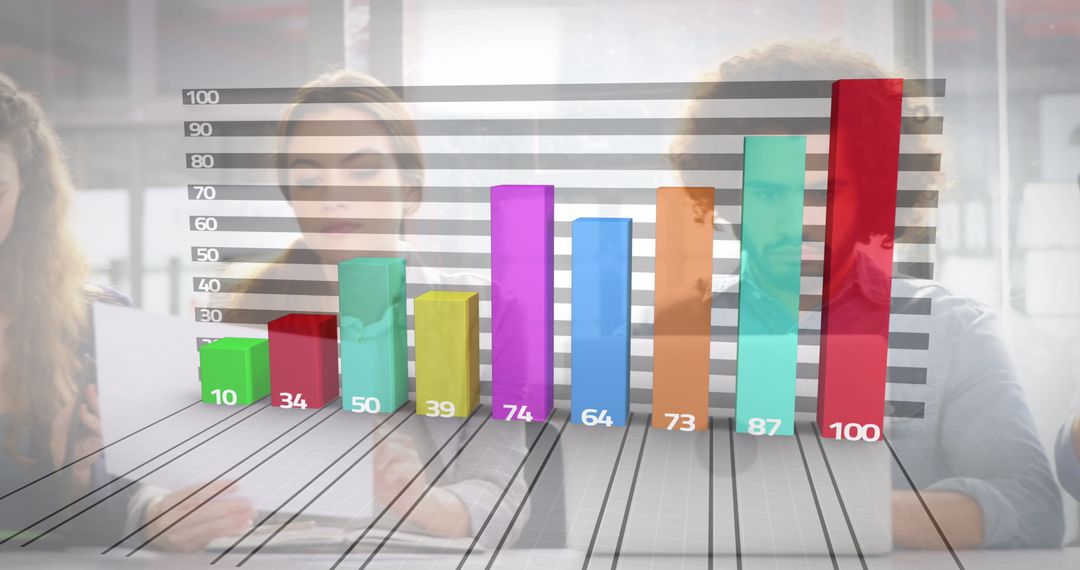
- Rising 3D Glass Bar Chart Showing Glossy Blue-Green Columns with White Trend Lines
Rising 3D Glass Bar Chart Showing Glossy Blue-Green Columns with White Trend Lines Image

AI Generated Image. Abstract 3D bar chart featuring translucent blue and green glossy columns arranged in ascending order, overlaid with white curved trend lines and subtle floor reflections. Clean pale gradient backdrop and flowing light streak accents reinforcing sense of upward momentum and modern data aesthetic. Composition focusing on rising performance narrative and clear value visualization. Suiting business presentations, financial reports, corporate websites, investor decks, analytics dashboards, blog headers, marketing materials, pitch decks, social posts highlighting growth metrics. Offering high-resolution output and clean vector-like 3D rendering compatible with print and digital. Leaving empty left-side space for copy or overlaying transparent panel for text. Adjusting colors to match brand palette, cropping to wide banner for website hero, or adding data labels and icons to convert into infographic. Noting AI-generated abstract style; disclosing as needed for editorial or regulated contexts.
Powered by  - Get 15% off with code: PIKWIZARD15


0
downloads
downloads
Tags:
More
Credit Photo
If you would like to credit the Photo, here are some ways you can do so
Text Link
photo Link
<span class="text-link">
<span>
<a target="_blank" href=https://pikwizard.com/photo/rising-3d-glass-bar-chart-showing-glossy-blue-green-columns-with-white-trend-lines/23b215fb96615006e647a5479029b4f4/>PikWizard</a>
</span>
</span>
<span class="image-link">
<span
style="margin: 0 0 20px 0; display: inline-block; vertical-align: middle; width: 100%;"
>
<a
target="_blank"
href="https://pikwizard.com/photo/rising-3d-glass-bar-chart-showing-glossy-blue-green-columns-with-white-trend-lines/23b215fb96615006e647a5479029b4f4/"
style="text-decoration: none; font-size: 10px; margin: 0;"
>
<img src="https://pikwizard.com/pw/medium/23b215fb96615006e647a5479029b4f4.jpg" style="margin: 0; width: 100%;" alt="" />
<p style="font-size: 12px; margin: 0;">PikWizard</p>
</a>
</span>
</span>
Free (free of charge)
Free for personal and commercial use.
Author: AI Creator
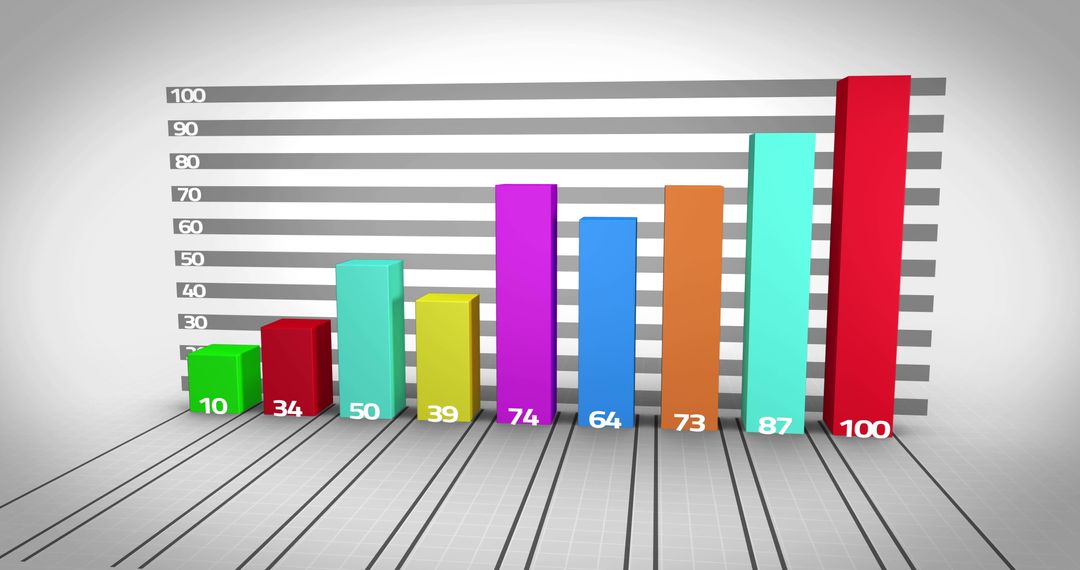
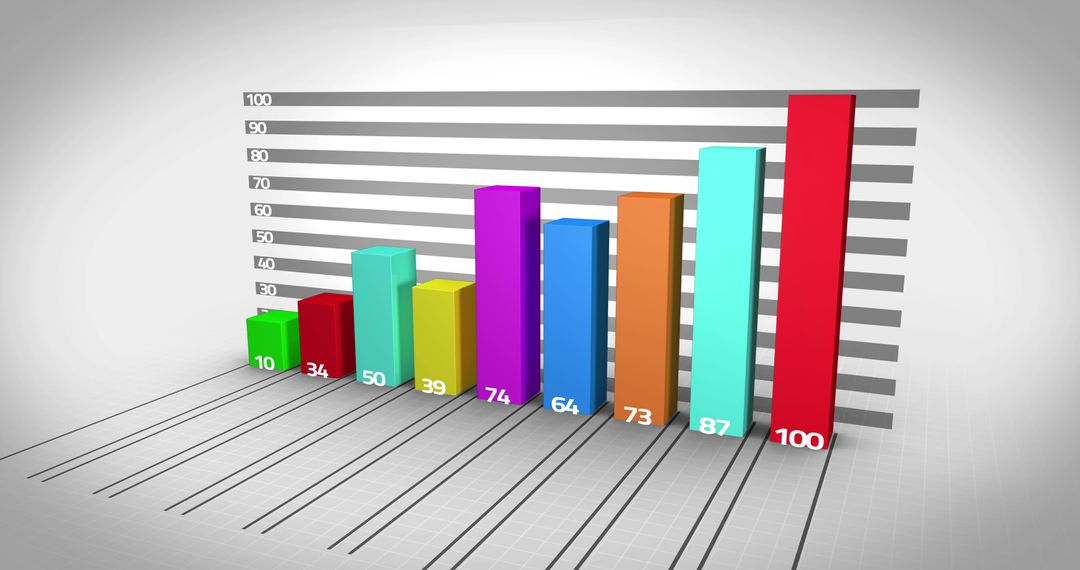
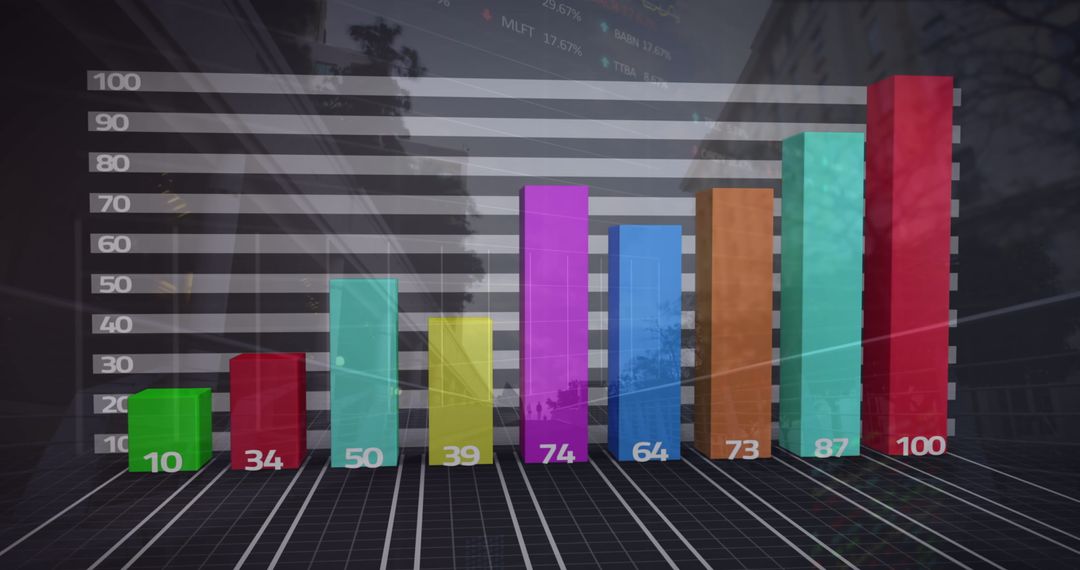
Similar Free Stock Images

Premium


Premium


Premium


Premium


Premium

Premium


Premium


Premium


Premium

Premium


Premium


Premium


Premium


Premium


Premium


Premium


Premium


Premium


Premium


Premium


Premium


Premium


Premium


Premium