
- Home >
- Stock Photos >
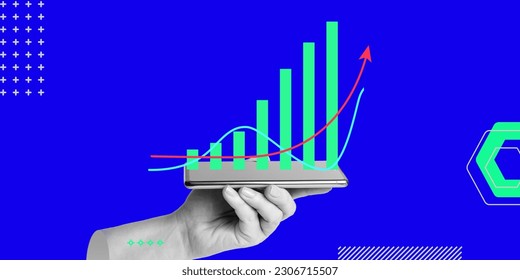
- Rising Data Trends on Gradient Graph with Business Insights
Rising Data Trends on Gradient Graph with Business Insights Image

Depicts financial or business trends with emphasis on growth. Ideal for presentations on market analytics, statistical data reports, or financial growth strategies. Can be used in newsletters, business websites, or technology articles to illustrate financial forecasts and data-driven decisions.
Powered by  - Get 15% off with code: PIKWIZARD15


2
downloads
downloads
Tags:
More
Credit Photo
If you would like to credit the Photo, here are some ways you can do so
Text Link
photo Link
<span class="text-link">
<span>
<a target="_blank" href=https://pikwizard.com/photo/rising-data-trends-on-gradient-graph-with-business-insights/6efcedc97cc59283ed2a7a98236adda9/>PikWizard</a>
</span>
</span>
<span class="image-link">
<span
style="margin: 0 0 20px 0; display: inline-block; vertical-align: middle; width: 100%;"
>
<a
target="_blank"
href="https://pikwizard.com/photo/rising-data-trends-on-gradient-graph-with-business-insights/6efcedc97cc59283ed2a7a98236adda9/"
style="text-decoration: none; font-size: 10px; margin: 0;"
>
<img src="https://pikwizard.com/pw/medium/6efcedc97cc59283ed2a7a98236adda9.jpg" style="margin: 0; width: 100%;" alt="" />
<p style="font-size: 12px; margin: 0;">PikWizard</p>
</a>
</span>
</span>
Free (free of charge)
Free for personal and commercial use.
Author: People Creations
Similar Free Stock Images

Premium


Premium


Premium


Premium


Premium


Premium


Premium


Premium


Premium


Premium


Premium


Premium


Premium


Premium


Premium


Premium


Premium


Premium


Premium


Premium


Premium


Premium


Premium


Premium

