
- Home >
- Stock Photos >
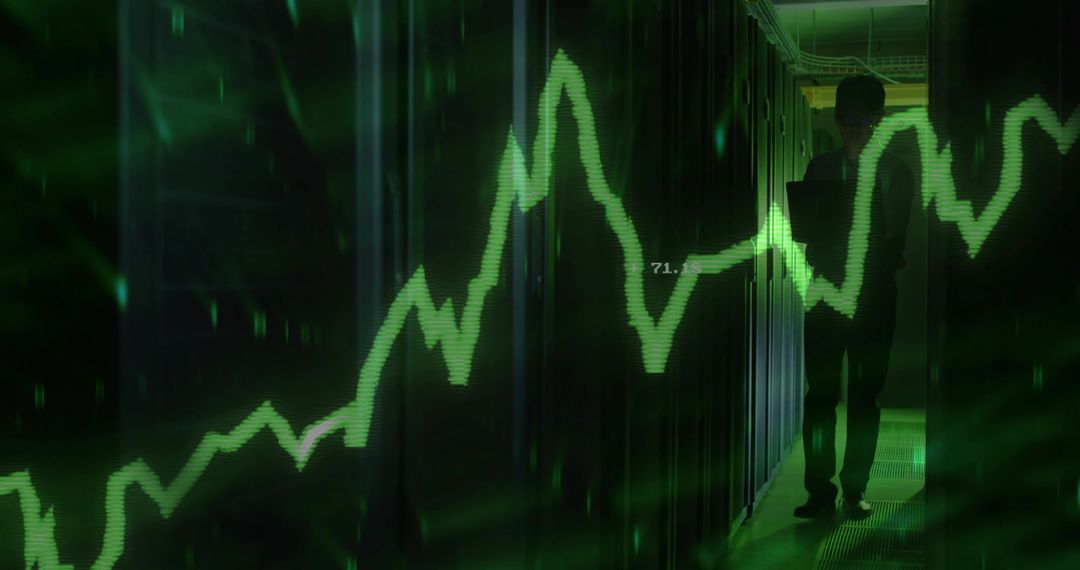
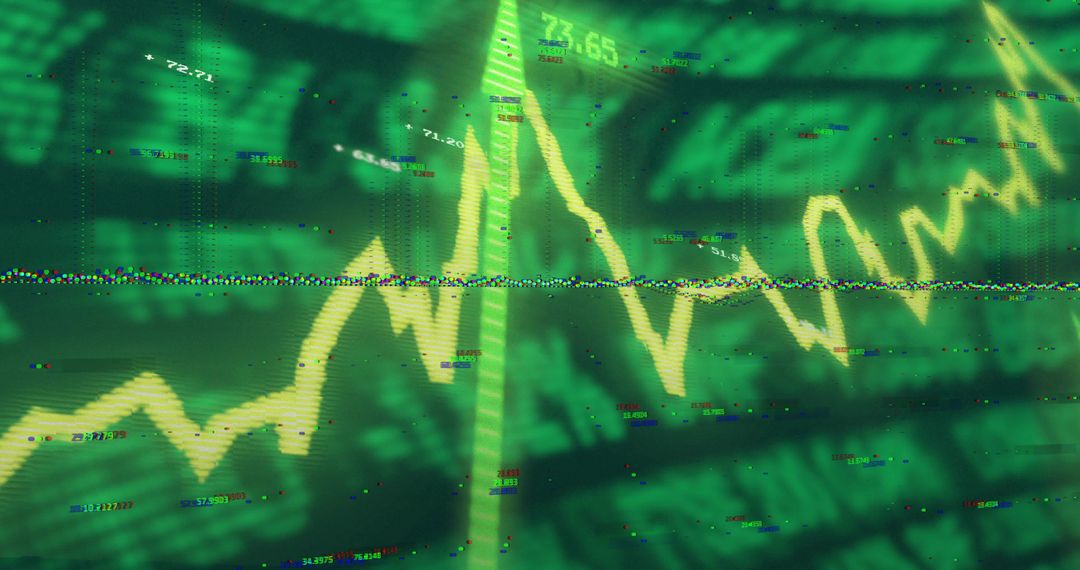
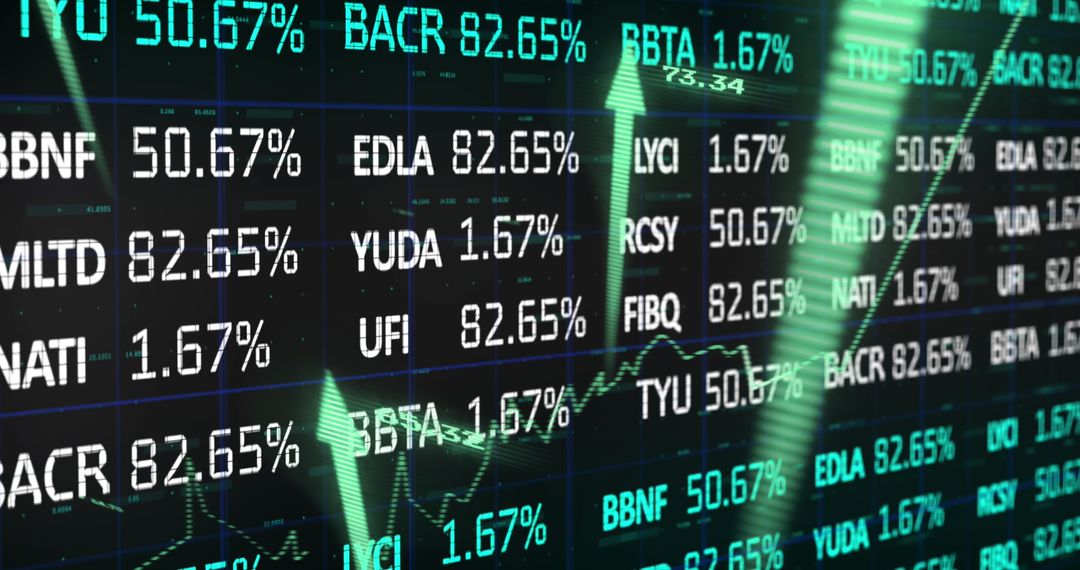
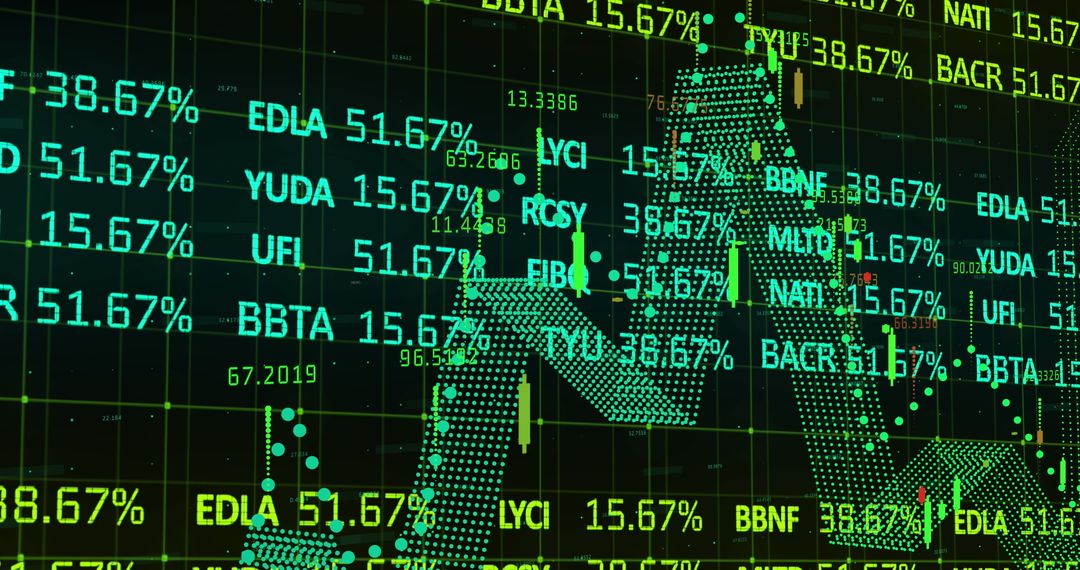
- Rising Financial Graph on Green Global Market Interface
Rising Financial Graph on Green Global Market Interface Image

This dynamically illustrated financial chart features an upward-trending line on a vibrant green digital grid interlaced with abstract ticker symbols. Ideal for presentations and reports on market trends, investments, and business analytics. Useful for financial technology initiatives or creating educational content that demystifies complex economic concepts.
Powered by 


0
downloads
downloads
Tags:
More
Credit Photo
If you would like to credit the Photo, here are some ways you can do so
Text Link
photo Link
<span class="text-link">
<span>
<a target="_blank" href=https://pikwizard.com/photo/rising-financial-graph-on-green-global-market-interface/f452abae906528226dd79638f0b6c09a/>PikWizard</a>
</span>
</span>
<span class="image-link">
<span
style="margin: 0 0 20px 0; display: inline-block; vertical-align: middle; width: 100%;"
>
<a
target="_blank"
href="https://pikwizard.com/photo/rising-financial-graph-on-green-global-market-interface/f452abae906528226dd79638f0b6c09a/"
style="text-decoration: none; font-size: 10px; margin: 0;"
>
<img src="https://pikwizard.com/pw/medium/f452abae906528226dd79638f0b6c09a.jpg" style="margin: 0; width: 100%;" alt="" />
<p style="font-size: 12px; margin: 0;">PikWizard</p>
</a>
</span>
</span>
Free (free of charge)
Free for personal and commercial use.
Author: Creative Art
Similar Free Stock Images

Premium


Premium


Premium


Premium


Premium


Premium


Premium


Premium


Premium


Premium


Premium


Premium


Premium


Premium


Premium


Premium


Premium


Premium


Premium


Premium


Premium


Premium


Premium


Premium

