- Home >
- Stock Photos >
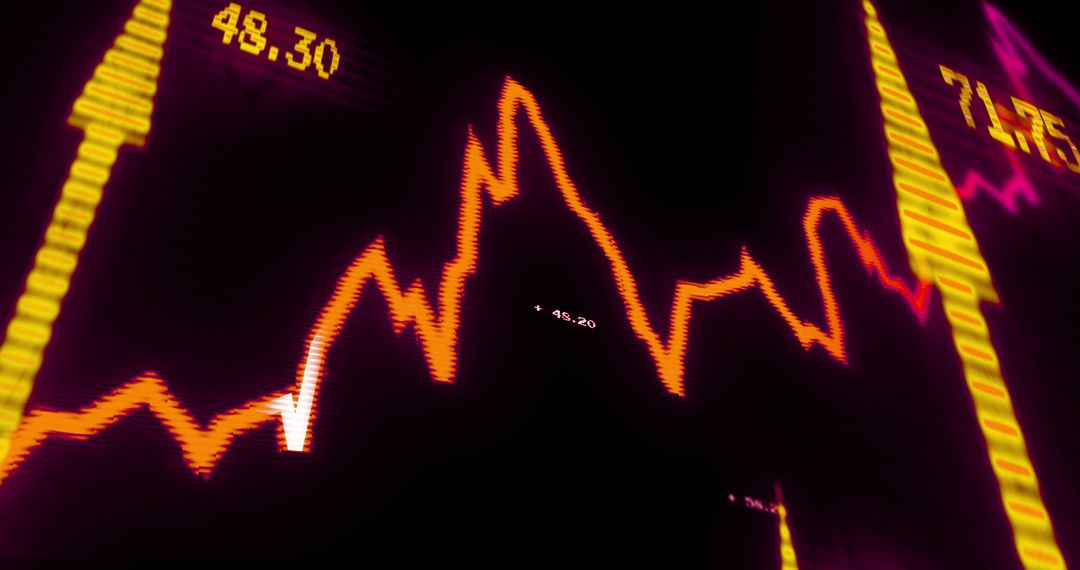
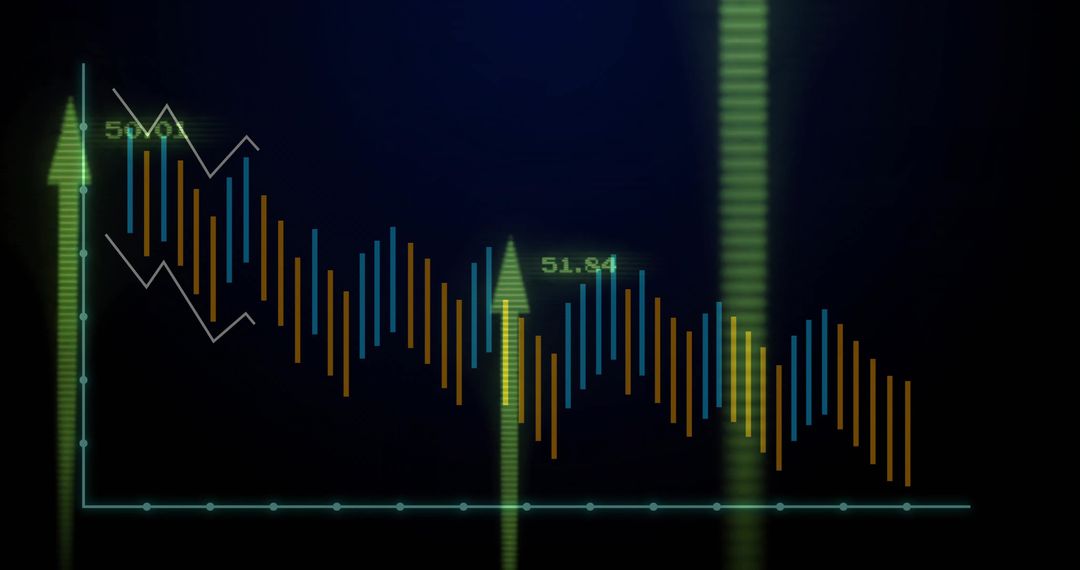
- Rising Financial Market Trends with Data Visualization
Rising Financial Market Trends with Data Visualization Image

Focus on rising and falling trends represented by arrows intersecting line graphs. Ideal for illustrating financial articles covering market fluctuations, business planning presentations needing visuals of economic trends, or teaching materials in finance courses.
Powered by  - Get 15% off with code: PIKWIZARD15


2
downloads
downloads
Tags:
More
Credit Photo
If you would like to credit the Photo, here are some ways you can do so
Text Link
photo Link
<span class="text-link">
<span>
<a target="_blank" href=https://pikwizard.com/photo/rising-financial-market-trends-with-data-visualization/43c59c163f4daf933e484d22587bde17/>PikWizard</a>
</span>
</span>
<span class="image-link">
<span
style="margin: 0 0 20px 0; display: inline-block; vertical-align: middle; width: 100%;"
>
<a
target="_blank"
href="https://pikwizard.com/photo/rising-financial-market-trends-with-data-visualization/43c59c163f4daf933e484d22587bde17/"
style="text-decoration: none; font-size: 10px; margin: 0;"
>
<img src="https://pikwizard.com/pw/medium/43c59c163f4daf933e484d22587bde17.jpg" style="margin: 0; width: 100%;" alt="" />
<p style="font-size: 12px; margin: 0;">PikWizard</p>
</a>
</span>
</span>
Free (free of charge)
Free for personal and commercial use.
Author: Authentic Images
Similar Free Stock Images

Premium


Premium


Premium


Premium


Premium


Premium


Premium


Premium


Premium


Premium


Premium


Premium


Premium


Premium


Premium


Premium


Premium


Premium


Premium


Premium


Premium


Premium


Premium


Premium