
- Home >
- Stock Photos >
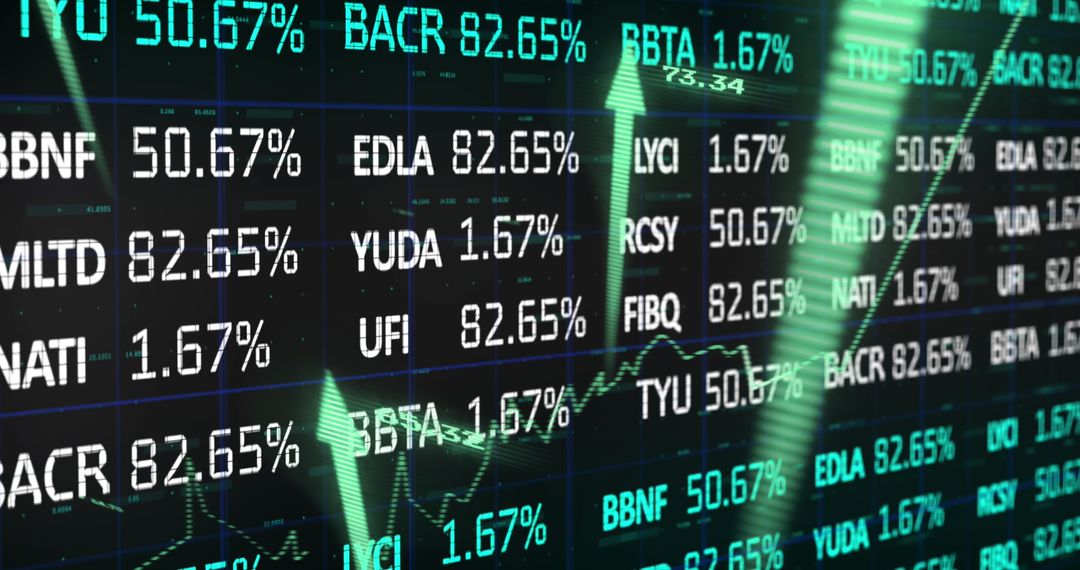
- Rising Market Trends with Green Line Graph and Arrow Indicators
Rising Market Trends with Green Line Graph and Arrow Indicators Image

Perfect for illustrating articles and tutorials about market dynamics, the rising green line graph signifies growth and upward trends in financial markets. Vibrant visuals can be used in media discussing economic forecasts, investment strategies, or technological impacts on trading practices. Ideal for financial websites, business reports, and educational content on financial trends.
Powered by  - Get 15% off with code: PIKWIZARD15


0
downloads
downloads
Tags:
More
Credit Photo
If you would like to credit the Photo, here are some ways you can do so
Text Link
photo Link
<span class="text-link">
<span>
<a target="_blank" href=https://pikwizard.com/photo/rising-market-trends-with-green-line-graph-and-arrow-indicators/2b6af0ddcc092e2cc348b343f41c1074/>PikWizard</a>
</span>
</span>
<span class="image-link">
<span
style="margin: 0 0 20px 0; display: inline-block; vertical-align: middle; width: 100%;"
>
<a
target="_blank"
href="https://pikwizard.com/photo/rising-market-trends-with-green-line-graph-and-arrow-indicators/2b6af0ddcc092e2cc348b343f41c1074/"
style="text-decoration: none; font-size: 10px; margin: 0;"
>
<img src="https://pikwizard.com/pw/medium/2b6af0ddcc092e2cc348b343f41c1074.jpg" style="margin: 0; width: 100%;" alt="" />
<p style="font-size: 12px; margin: 0;">PikWizard</p>
</a>
</span>
</span>
Free (free of charge)
Free for personal and commercial use.
Author: People Creations
Similar Free Stock Images

Premium


Premium


Premium


Premium


Premium


Premium


Premium


Premium


Premium


Premium


Premium


Premium


Premium


Premium


Premium


Premium


Premium


Premium


Premium


Premium


Premium


Premium


Premium


Premium

