- Home >
- Stock Photos >
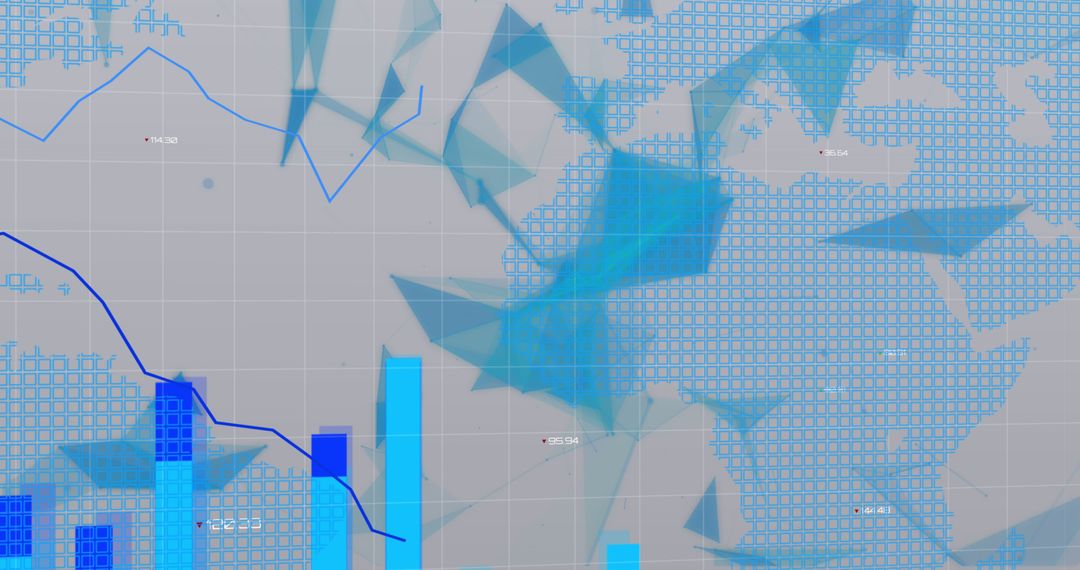
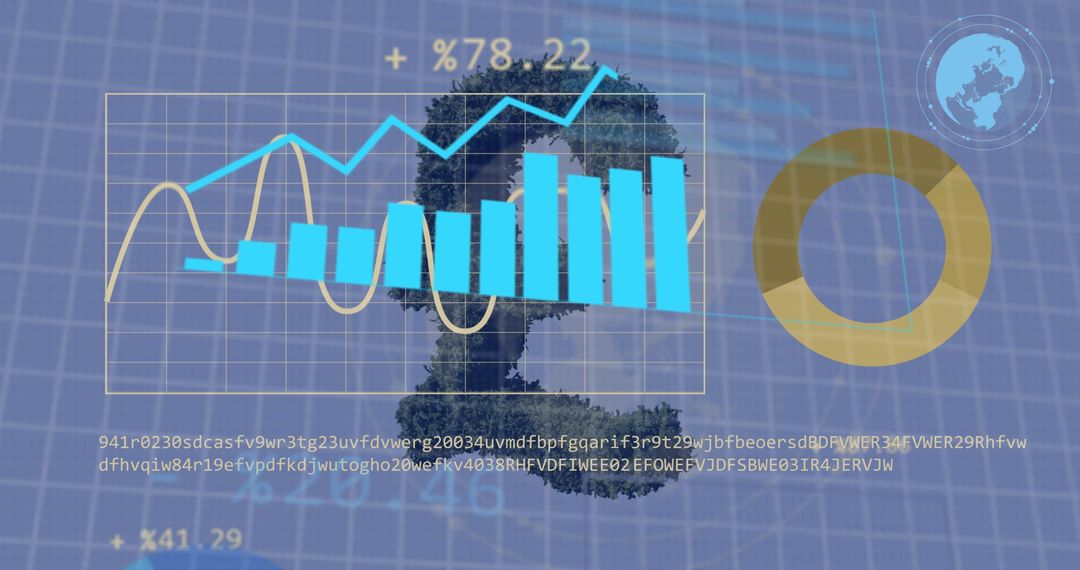
- Rising navy jagged line chart over grid dashboard with analysing data panel and pie elements
Rising navy jagged line chart over grid dashboard with analysing data panel and pie elements Image

Showing navy jagged line rising across grid dashboard with translucent secondary line, circular pie segments, and subtle binary code overlay. Featuring analysing data panel with CSV-style table listing sample company records and numeric metrics. Using strong blue and purple palette for corporate, fintech, and tech branding. Suitable for illustrating data analysis, market trend reporting, financial performance, KPI dashboards, and business presentations. Ideal for website headers, slide decks, blog visuals, social posts, ad banners, annual reports, and training materials. Editable concept for adding custom text, logos, or specific metrics, and layering under headlines or overviews to reinforce analytic storytelling.
Powered by 


0
downloads
downloads
Tags:
More
Credit Photo
If you would like to credit the Photo, here are some ways you can do so
Text Link
photo Link
<span class="text-link">
<span>
<a target="_blank" href=https://pikwizard.com/photo/rising-navy-jagged-line-chart-over-grid-dashboard-with-analysing-data-panel-and-pie-elements/8aa9ee2b2397983b0d3333a02737a849/>PikWizard</a>
</span>
</span>
<span class="image-link">
<span
style="margin: 0 0 20px 0; display: inline-block; vertical-align: middle; width: 100%;"
>
<a
target="_blank"
href="https://pikwizard.com/photo/rising-navy-jagged-line-chart-over-grid-dashboard-with-analysing-data-panel-and-pie-elements/8aa9ee2b2397983b0d3333a02737a849/"
style="text-decoration: none; font-size: 10px; margin: 0;"
>
<img src="https://pikwizard.com/pw/medium/8aa9ee2b2397983b0d3333a02737a849.jpg" style="margin: 0; width: 100%;" alt="" />
<p style="font-size: 12px; margin: 0;">PikWizard</p>
</a>
</span>
</span>
Free (free of charge)
Free for personal and commercial use.
Author: Authentic Images
Similar Free Stock Images

Premium


Premium


Premium


Premium


Premium


Premium


Premium


Premium


Premium


Premium


Premium


Premium


Premium


Premium


Premium


Premium


Premium


Premium


Premium


Premium


Premium


Premium


Premium


Premium