- Home >
- Stock Photos >
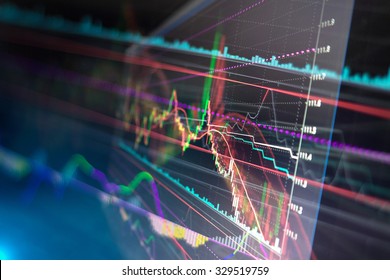
- Rising Red Line Graph with Stock Market Candlesticks Overlay
Rising Red Line Graph with Stock Market Candlesticks Overlay Image

Features a dynamic rising red line graph overlaid with candlestick bars, highlighting financial trends and stock market volatility. Suited for topics on investment analysis, financial technology improvement, and economic research. Ideal for financial presentations and articles on stock trading and portfolio performance forecasting.
Powered by  - Get 15% off with code: PIKWIZARD15


0
downloads
downloads
Tags:
More
Credit Photo
If you would like to credit the Photo, here are some ways you can do so
Text Link
photo Link
<span class="text-link">
<span>
<a target="_blank" href=https://pikwizard.com/photo/rising-red-line-graph-with-stock-market-candlesticks-overlay/e4dcf445ebd333c08c966da119ef3905/>PikWizard</a>
</span>
</span>
<span class="image-link">
<span
style="margin: 0 0 20px 0; display: inline-block; vertical-align: middle; width: 100%;"
>
<a
target="_blank"
href="https://pikwizard.com/photo/rising-red-line-graph-with-stock-market-candlesticks-overlay/e4dcf445ebd333c08c966da119ef3905/"
style="text-decoration: none; font-size: 10px; margin: 0;"
>
<img src="https://pikwizard.com/pw/medium/e4dcf445ebd333c08c966da119ef3905.jpg" style="margin: 0; width: 100%;" alt="" />
<p style="font-size: 12px; margin: 0;">PikWizard</p>
</a>
</span>
</span>
Free (free of charge)
Free for personal and commercial use.
Author: Awesome Content
Similar Free Stock Images

Premium


Premium


Premium


Premium


Premium


Premium


Premium


Premium


Premium


Premium


Premium


Premium


Premium


Premium


Premium


Premium


Premium


Premium


Premium


Premium


Premium


Premium


Premium


Premium


Premium