- Home >
- Stock Photos >
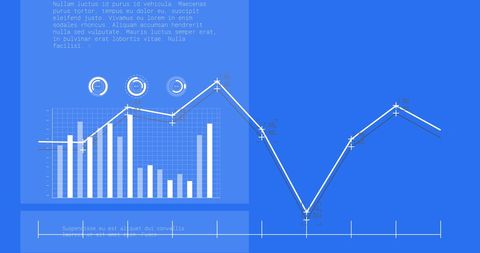
- Rising Trend Line on Turquoise Background
Rising Trend Line on Turquoise Background Image

AI Generated Image. Illustrating a successful data trend, this graphic showcases an upward arrow on an XY axis set against a vibrant turquoise background. Ideal for presentations, analytical reports, or any context requiring clear infographics. Great for conveying messages related to business growth, success simulations, technical improvements, or market analysis.
Powered by  - Get 15% off with code: PIKWIZARD15


0
downloads
downloads
Tags:
More
Credit Photo
If you would like to credit the Photo, here are some ways you can do so
Text Link
photo Link
<span class="text-link">
<span>
<a target="_blank" href=https://pikwizard.com/photo/rising-trend-line-on-turquoise-background/866a76f7412f7e32f822efb4ac00ba9e/>PikWizard</a>
</span>
</span>
<span class="image-link">
<span
style="margin: 0 0 20px 0; display: inline-block; vertical-align: middle; width: 100%;"
>
<a
target="_blank"
href="https://pikwizard.com/photo/rising-trend-line-on-turquoise-background/866a76f7412f7e32f822efb4ac00ba9e/"
style="text-decoration: none; font-size: 10px; margin: 0;"
>
<img src="https://pikwizard.com/pw/medium/866a76f7412f7e32f822efb4ac00ba9e.jpg" style="margin: 0; width: 100%;" alt="" />
<p style="font-size: 12px; margin: 0;">PikWizard</p>
</a>
</span>
</span>
Free (free of charge)
Free for personal and commercial use.
Author: AI Creator
Similar Free Stock Images

Premium


Premium


Premium


Premium


Premium


Premium


Premium


Premium


Premium


Premium


Premium


Premium


Premium


Premium


Premium


Premium


Premium


Premium


Premium


Premium


Premium


Premium


Premium


Premium


Premium