- Home >
- Stock Photos >
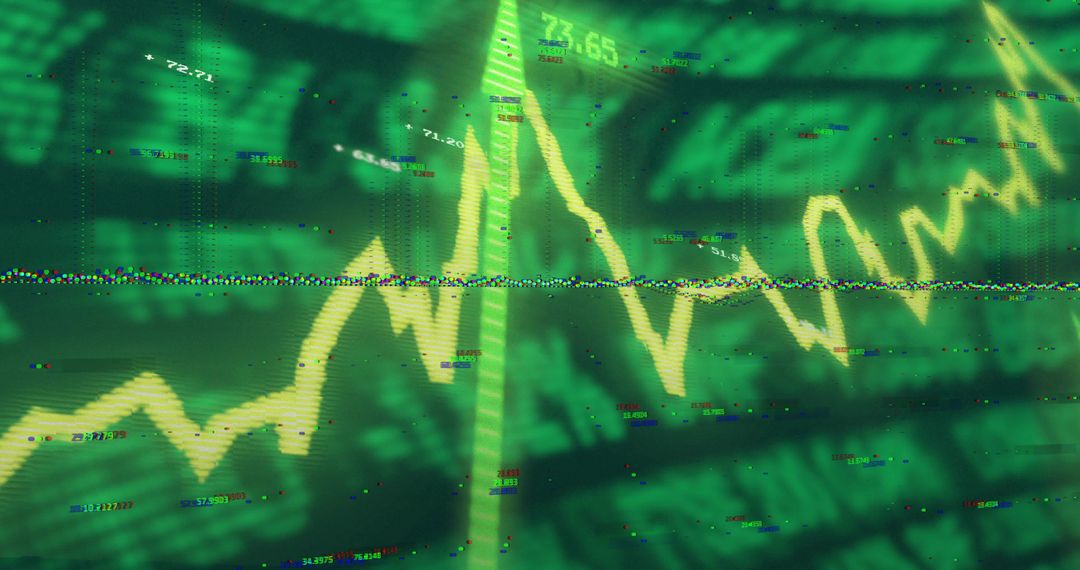
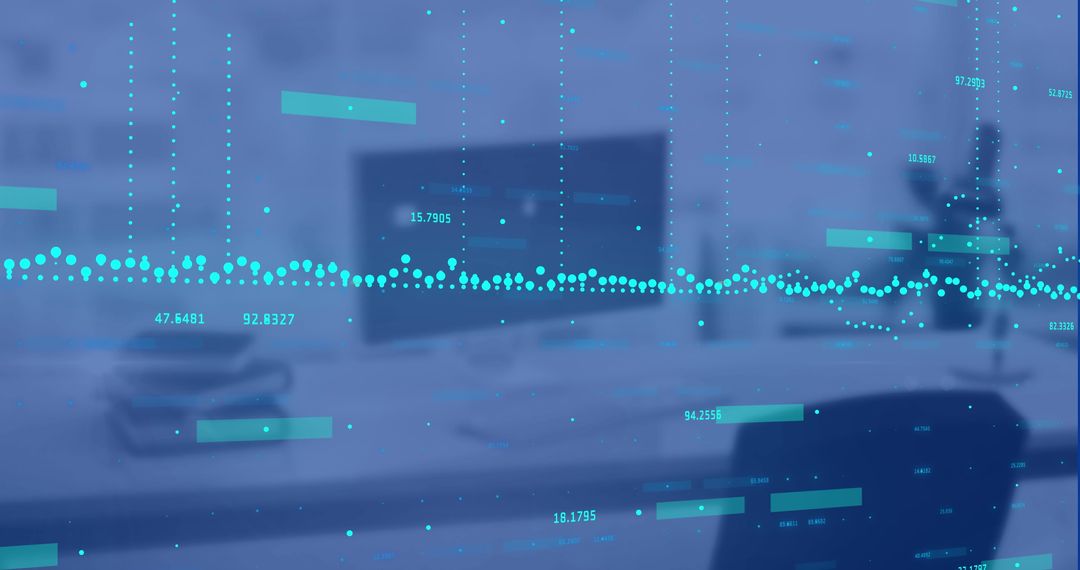
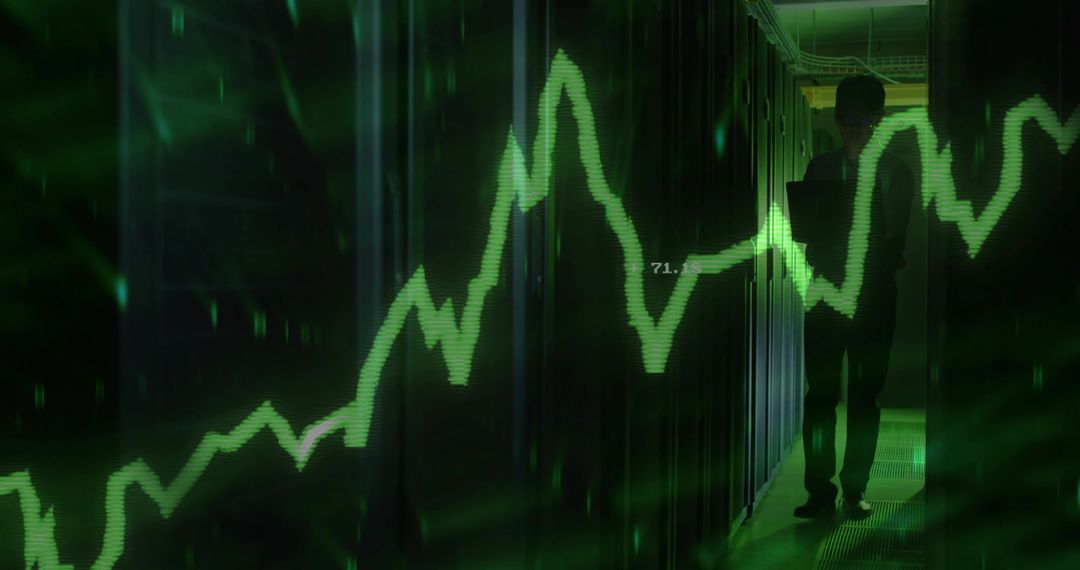
- Rising Trend on Digital Financial Analytics Screen
Rising Trend on Digital Financial Analytics Screen Image

Bright green graph showcases rising trend on a virtual data display. Useful for illustrating topics in finance, market investment, predictive analytics, and digital technology. Ideal for articles, presentations, and websites focusing on financial growth, analysis, and projections.
Powered by  - Get 15% off with code: PIKWIZARD15


0
downloads
downloads
Tags:
More
Credit Photo
If you would like to credit the Photo, here are some ways you can do so
Text Link
photo Link
<span class="text-link">
<span>
<a target="_blank" href=https://pikwizard.com/photo/rising-trend-on-digital-financial-analytics-screen/fc180a2d416a4d521ad6016fea3d673e/>PikWizard</a>
</span>
</span>
<span class="image-link">
<span
style="margin: 0 0 20px 0; display: inline-block; vertical-align: middle; width: 100%;"
>
<a
target="_blank"
href="https://pikwizard.com/photo/rising-trend-on-digital-financial-analytics-screen/fc180a2d416a4d521ad6016fea3d673e/"
style="text-decoration: none; font-size: 10px; margin: 0;"
>
<img src="https://pikwizard.com/pw/medium/fc180a2d416a4d521ad6016fea3d673e.jpg" style="margin: 0; width: 100%;" alt="" />
<p style="font-size: 12px; margin: 0;">PikWizard</p>
</a>
</span>
</span>
Free (free of charge)
Free for personal and commercial use.
Author: Authentic Images
Similar Free Stock Images

Premium


Premium


Premium


Premium


Premium


Premium


Premium


Premium


Premium


Premium


Premium


Premium


Premium


Premium


Premium


Premium


Premium


Premium


Premium


Premium


Premium


Premium


Premium


Premium