- Home >
- Stock Photos >
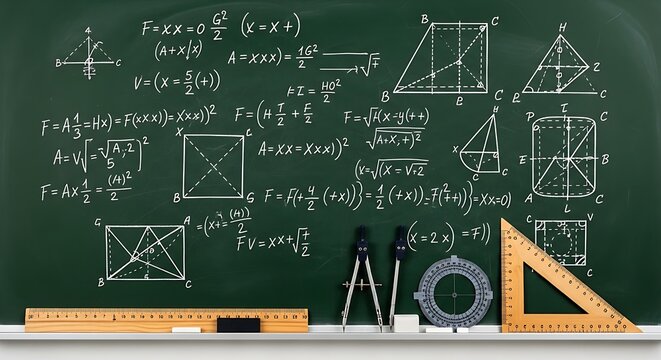
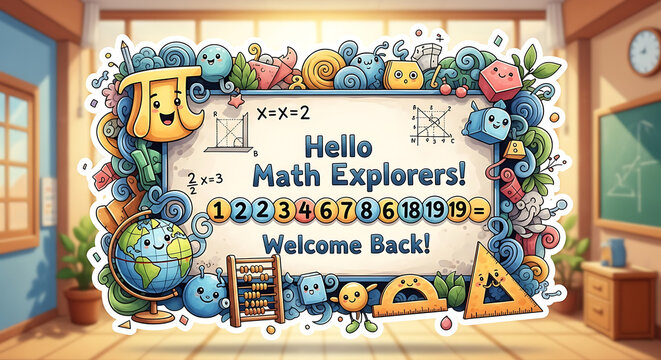
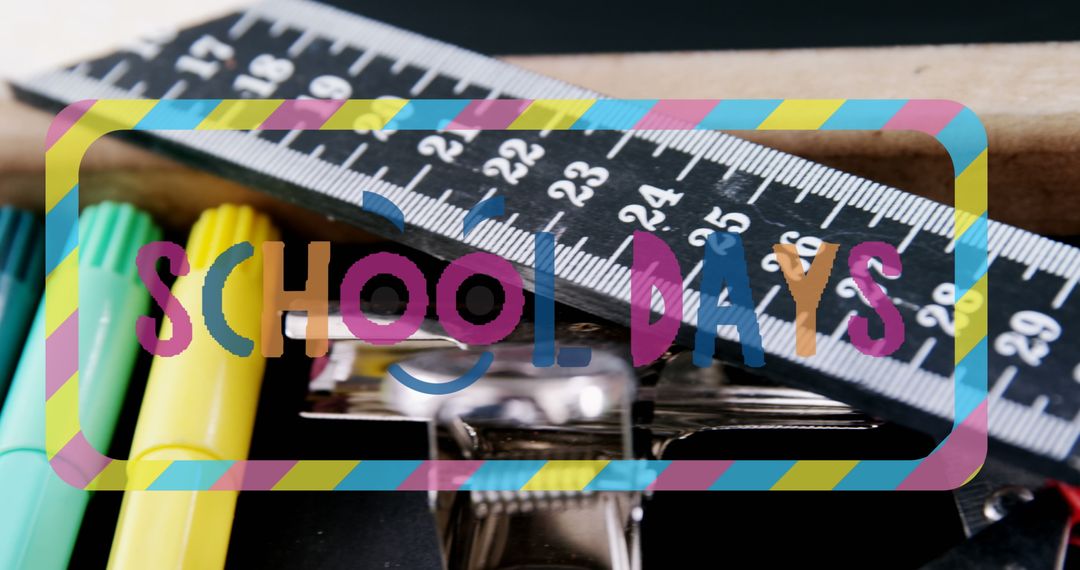
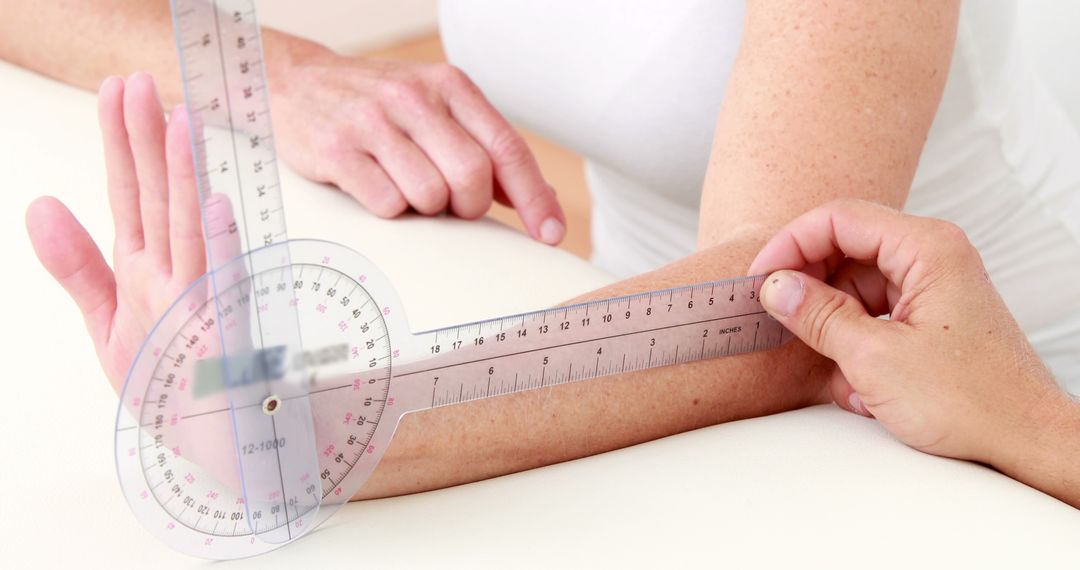
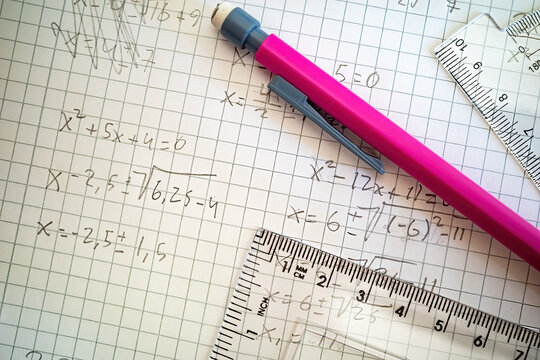
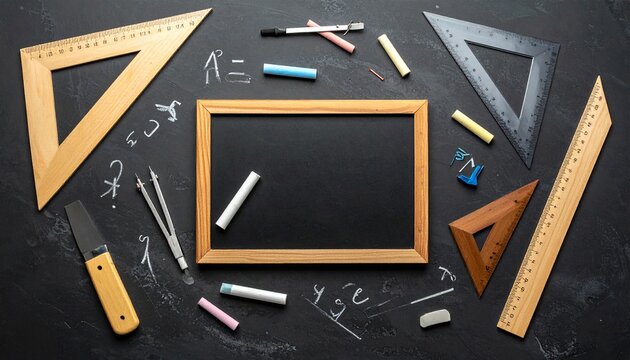
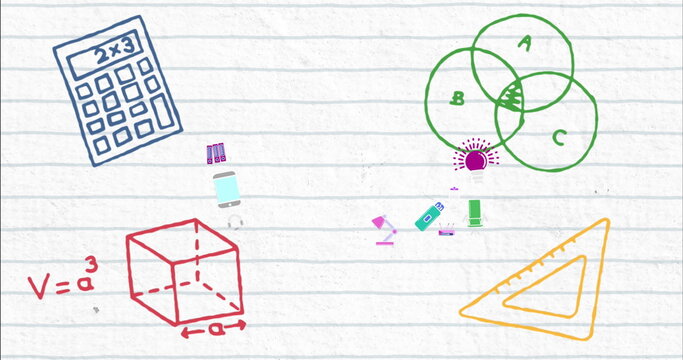
- Ruler Overlay on Floating Math Equations for Back to School Concept
Ruler Overlay on Floating Math Equations for Back to School Concept Image
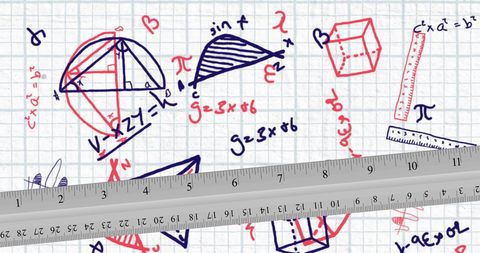
Design contains a ruler placed over diverse mathematical equations and symbols, creating an engaging educational background. Ideal for use in school presentations, math tutorial designs, educational materials, or advertising back-to-school promos.
Powered by 


2
downloads
downloads
Tags:
More
Credit Photo
If you would like to credit the Photo, here are some ways you can do so
Text Link
photo Link
<span class="text-link">
<span>
<a target="_blank" href=https://pikwizard.com/photo/ruler-overlay-on-floating-math-equations-for-back-to-school-concept/0838a2df71c14089e4378055957073b2/>PikWizard</a>
</span>
</span>
<span class="image-link">
<span
style="margin: 0 0 20px 0; display: inline-block; vertical-align: middle; width: 100%;"
>
<a
target="_blank"
href="https://pikwizard.com/photo/ruler-overlay-on-floating-math-equations-for-back-to-school-concept/0838a2df71c14089e4378055957073b2/"
style="text-decoration: none; font-size: 10px; margin: 0;"
>
<img src="https://pikwizard.com/pw/medium/0838a2df71c14089e4378055957073b2.jpg" style="margin: 0; width: 100%;" alt="" />
<p style="font-size: 12px; margin: 0;">PikWizard</p>
</a>
</span>
</span>
Free (free of charge)
Free for personal and commercial use.
Author: Authentic Images
Similar Free Stock Images
Premium


Premium


Premium


Premium


Premium


Premium


Premium


Premium


Premium


Premium


Premium


Premium


Premium


Premium


Premium


Premium


Premium


Premium


Premium


Premium


Premium


Premium


Premium


Premium