
- Home >
- Stock Photos >
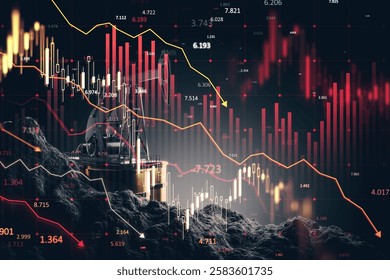
- Sharp Decline in Stock Market Graph Against Red Financial Data Background
Sharp Decline in Stock Market Graph Against Red Financial Data Background Image

Illustrates financial crisis or market downturn. Useful for articles on economy, business newsletters, finance blogs showcasing market trends and analysis. Effective for presentations on stock market analysis, reports on global financial fluctuations or strategic planning in unstable markets.
Powered by  - Get 15% off with code: PIKWIZARD15


2
downloads
downloads
Tags:
More
Credit Photo
If you would like to credit the Photo, here are some ways you can do so
Text Link
photo Link
<span class="text-link">
<span>
<a target="_blank" href=https://pikwizard.com/photo/sharp-decline-in-stock-market-graph-against-red-financial-data-background/b57d23037597c5138e919729c14aebeb/>PikWizard</a>
</span>
</span>
<span class="image-link">
<span
style="margin: 0 0 20px 0; display: inline-block; vertical-align: middle; width: 100%;"
>
<a
target="_blank"
href="https://pikwizard.com/photo/sharp-decline-in-stock-market-graph-against-red-financial-data-background/b57d23037597c5138e919729c14aebeb/"
style="text-decoration: none; font-size: 10px; margin: 0;"
>
<img src="https://pikwizard.com/pw/medium/b57d23037597c5138e919729c14aebeb.jpg" style="margin: 0; width: 100%;" alt="" />
<p style="font-size: 12px; margin: 0;">PikWizard</p>
</a>
</span>
</span>
Free (free of charge)
Free for personal and commercial use.
Author: Creative Art
Similar Free Stock Images

Premium


Premium


Premium


Premium


Premium


Premium


Premium


Premium


Premium


Premium


Premium


Premium


Premium


Premium


Premium


Premium


Premium


Premium


Premium


Premium


Premium


Premium


Premium


Premium


Premium

