- Home >
- Stock Photos >
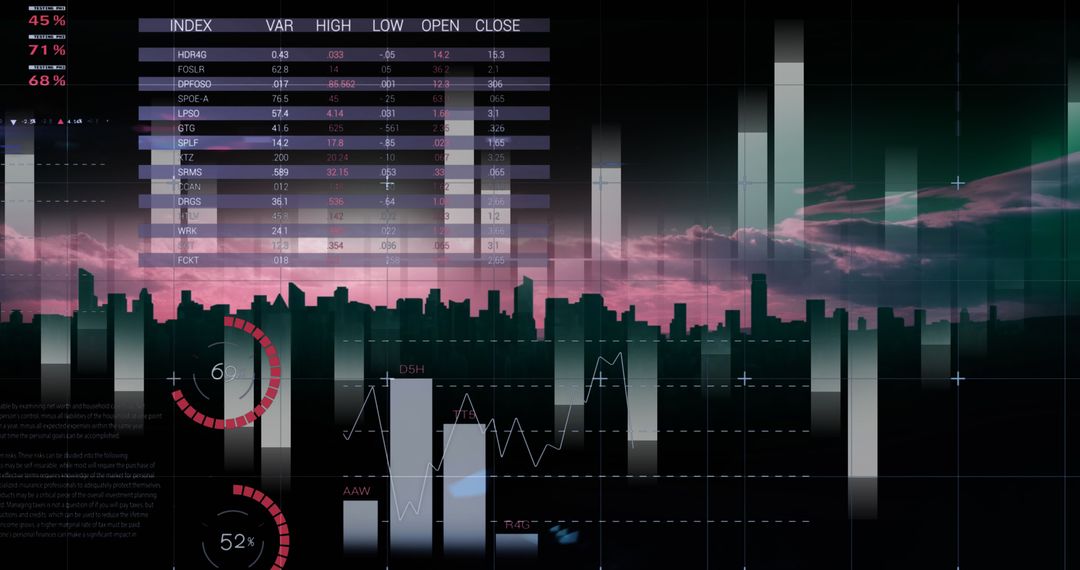
- Social Media Metrics Dashboard with Interactive Design Elements
Social Media Metrics Dashboard with Interactive Design Elements Image

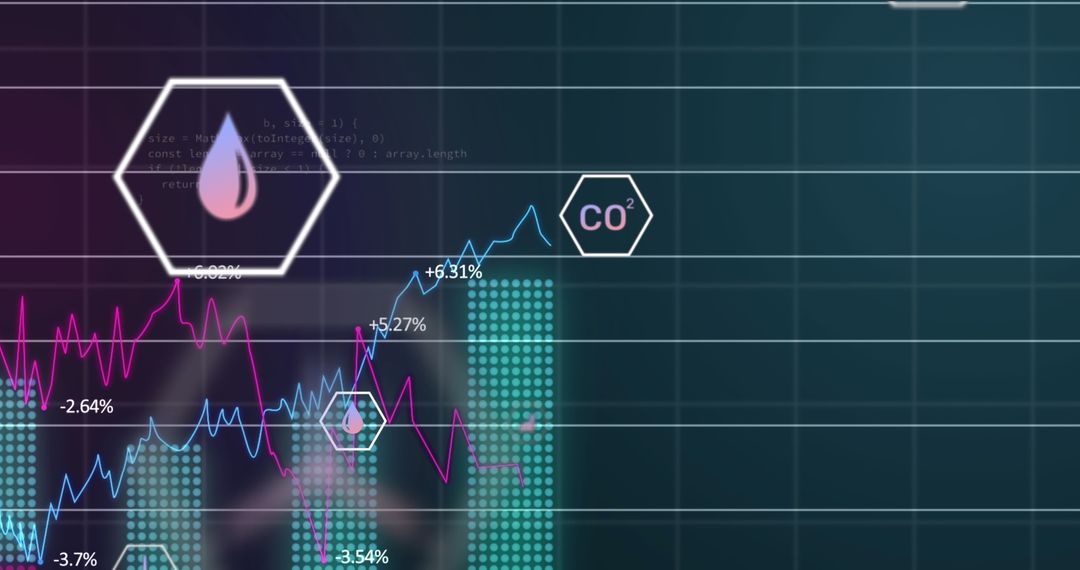
Visualization of social media metrics on a dynamic dashboard featuring turquoise bars, colored labels, and numeric data. Useful for presentations on digital analytics, trending technologies, or interface design. Can offer insights into audience engagement and content performance across social platforms.
Powered by 


0
downloads
downloads
Tags:
More
Credit Photo
If you would like to credit the Photo, here are some ways you can do so
Text Link
photo Link
<span class="text-link">
<span>
<a target="_blank" href=https://pikwizard.com/photo/social-media-metrics-dashboard-with-interactive-design-elements/414fdf0e0147f05689f29e8feb9f9c15/>PikWizard</a>
</span>
</span>
<span class="image-link">
<span
style="margin: 0 0 20px 0; display: inline-block; vertical-align: middle; width: 100%;"
>
<a
target="_blank"
href="https://pikwizard.com/photo/social-media-metrics-dashboard-with-interactive-design-elements/414fdf0e0147f05689f29e8feb9f9c15/"
style="text-decoration: none; font-size: 10px; margin: 0;"
>
<img src="https://pikwizard.com/pw/medium/414fdf0e0147f05689f29e8feb9f9c15.jpg" style="margin: 0; width: 100%;" alt="" />
<p style="font-size: 12px; margin: 0;">PikWizard</p>
</a>
</span>
</span>
Free (free of charge)
Free for personal and commercial use.
Author: Awesome Content
Similar Free Stock Images

Premium


Premium


Premium


Premium


Premium


Premium


Premium


Premium


Premium


Premium


Premium


Premium


Premium


Premium


Premium


Premium


Premium


Premium


Premium


Premium


Premium


Premium


Premium


Premium