
- Home >
- Stock Photos >
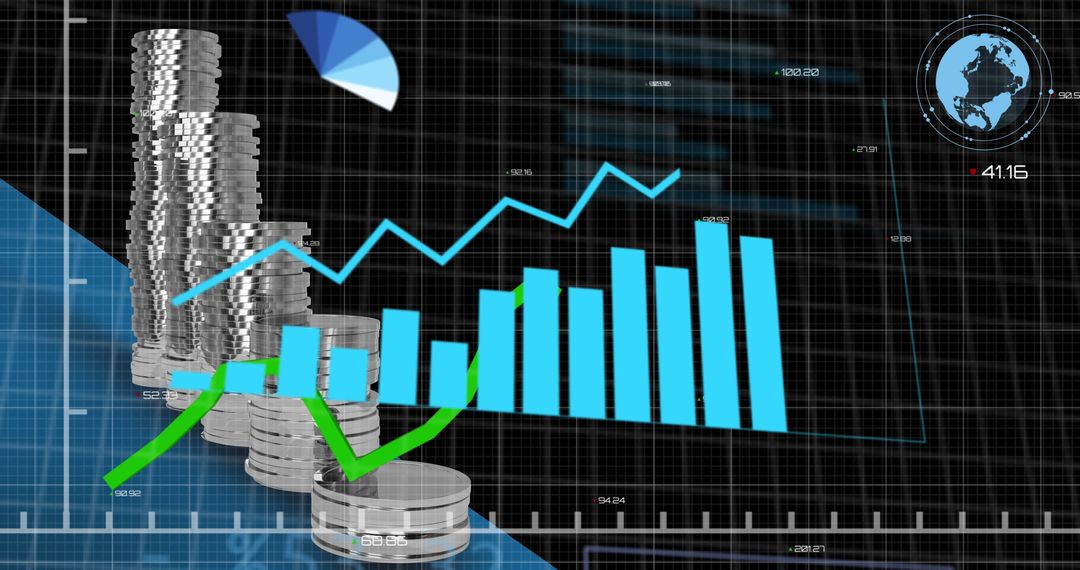
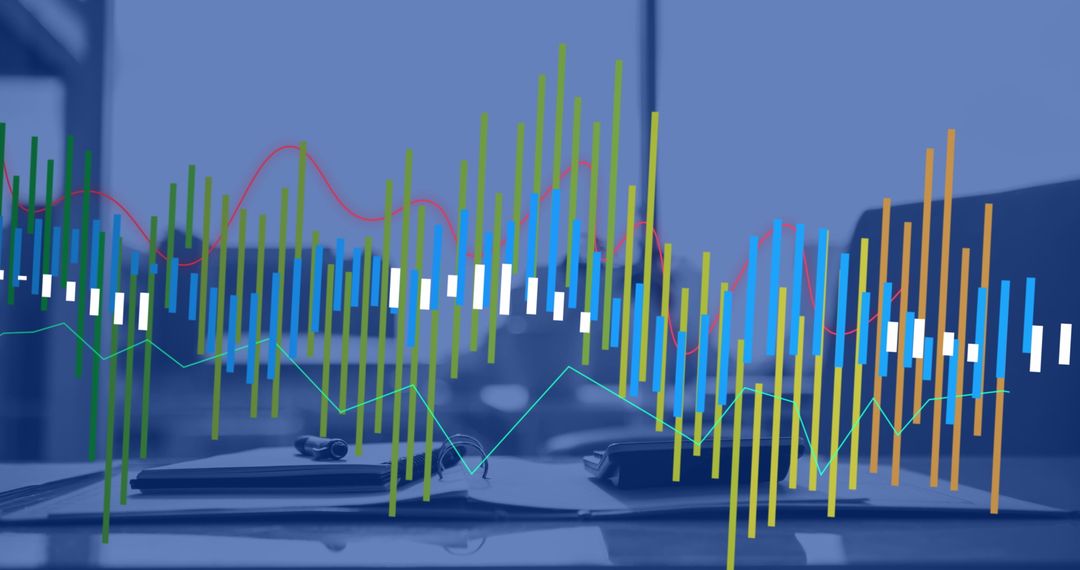
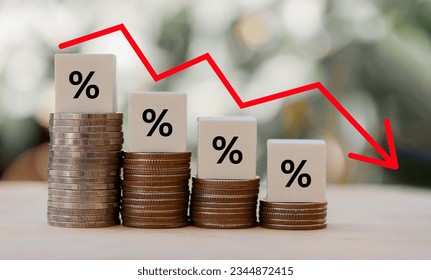
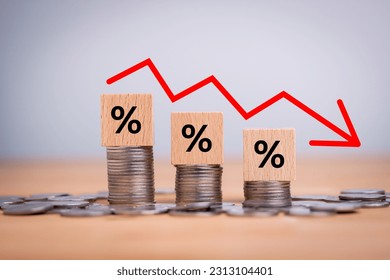
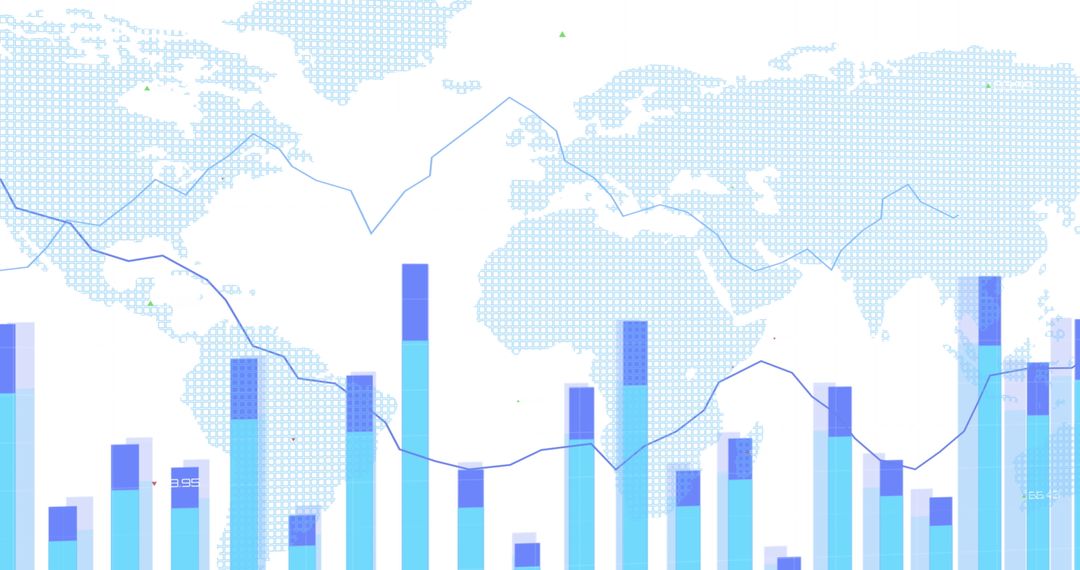
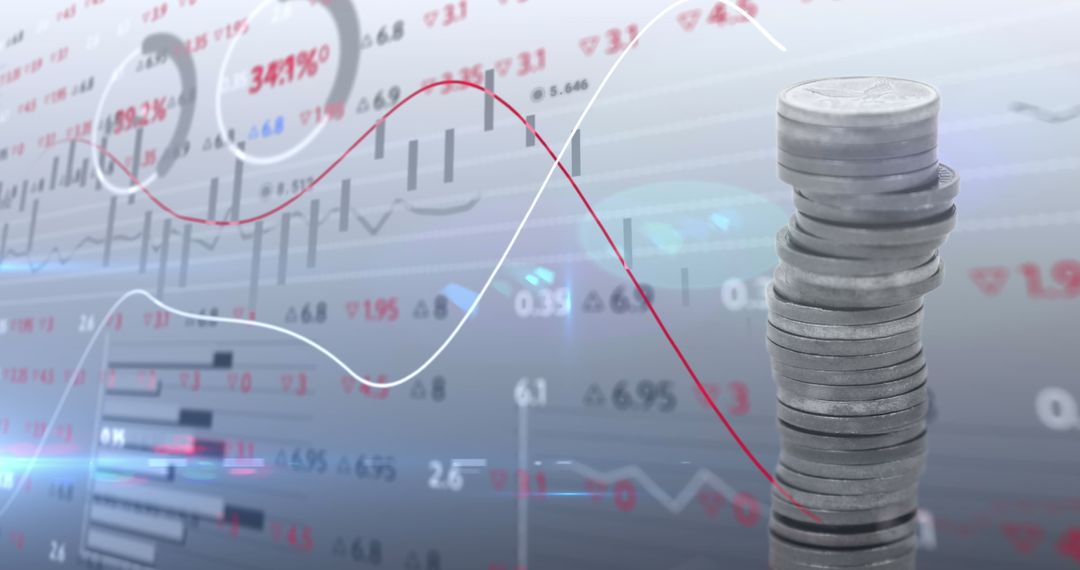
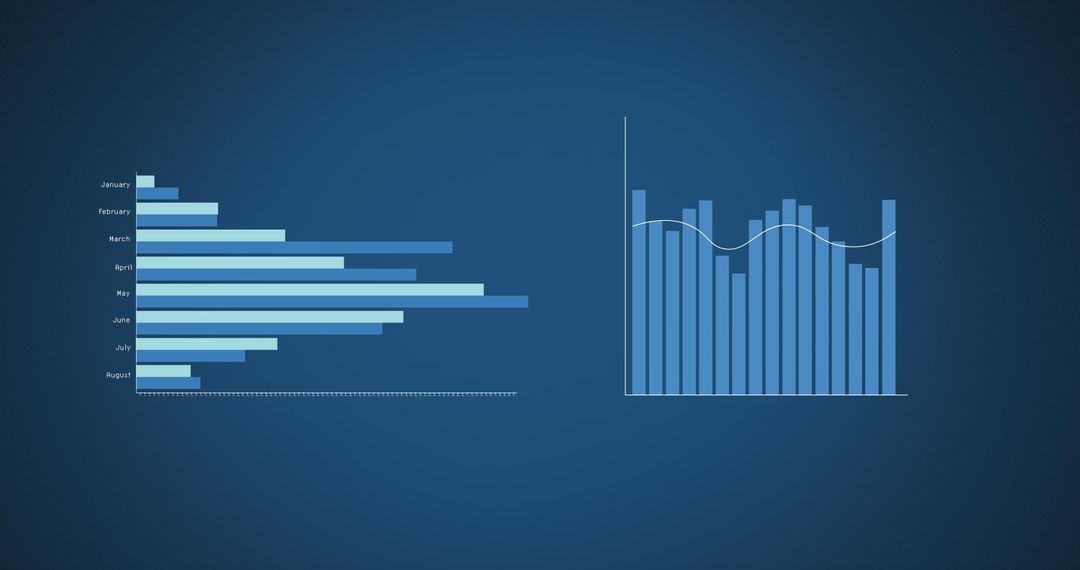
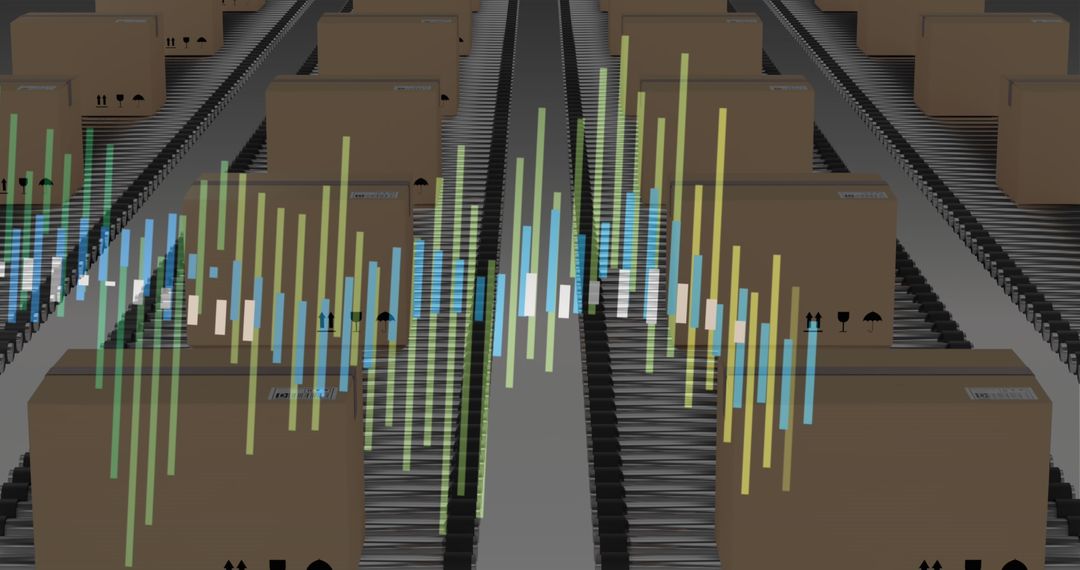
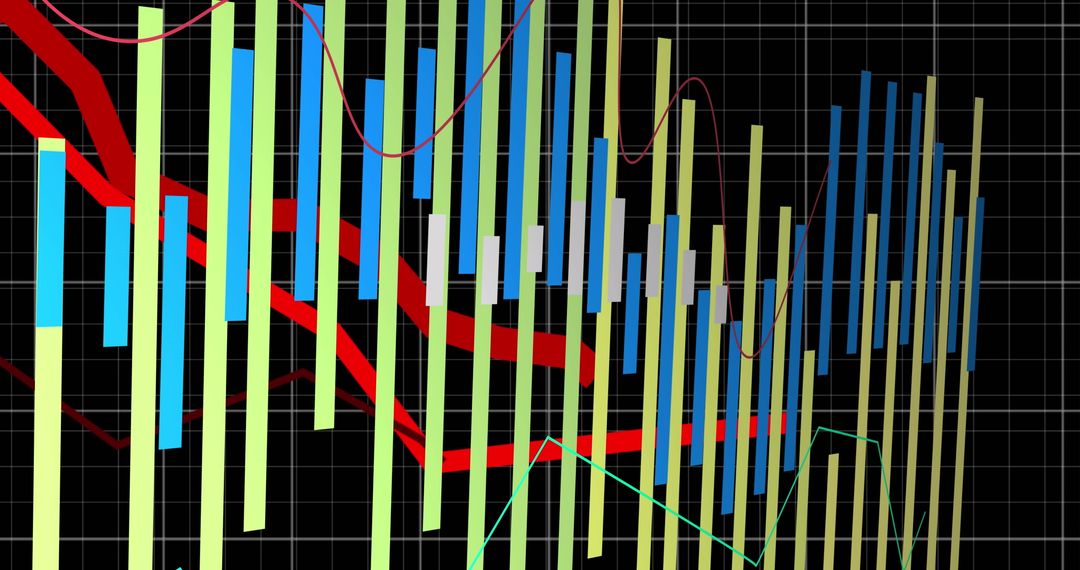
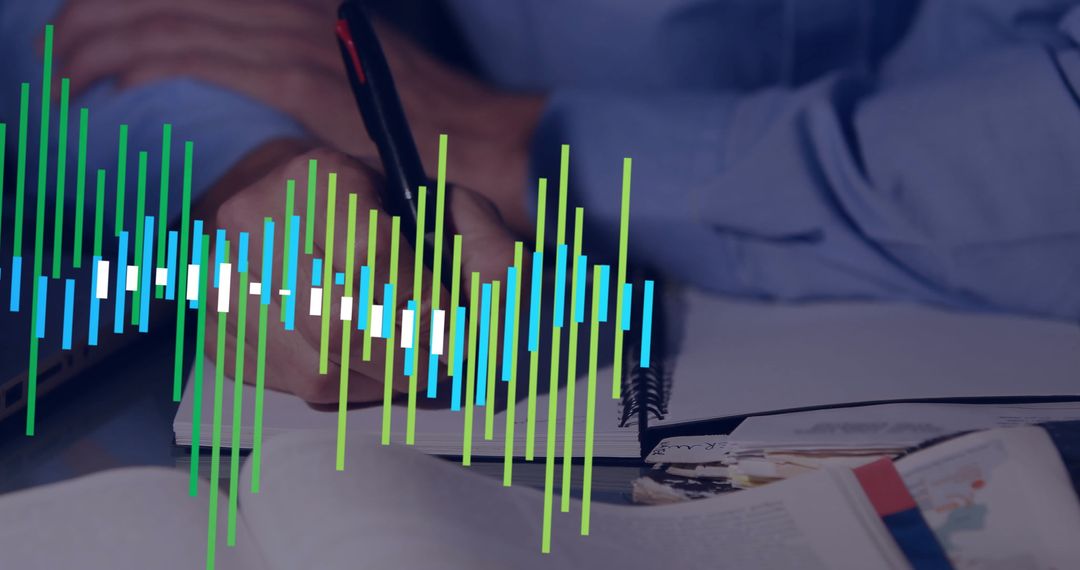
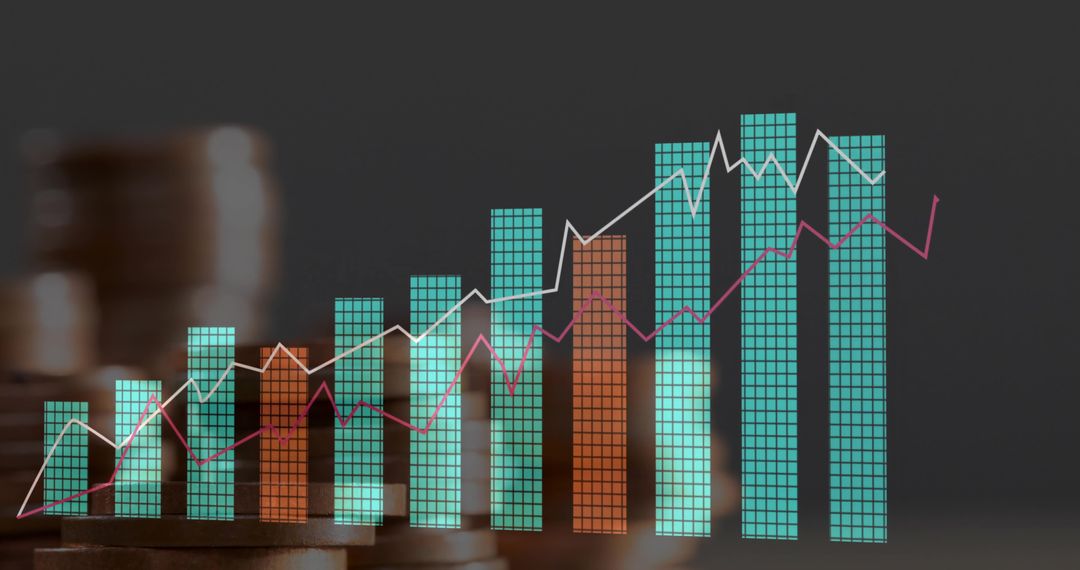
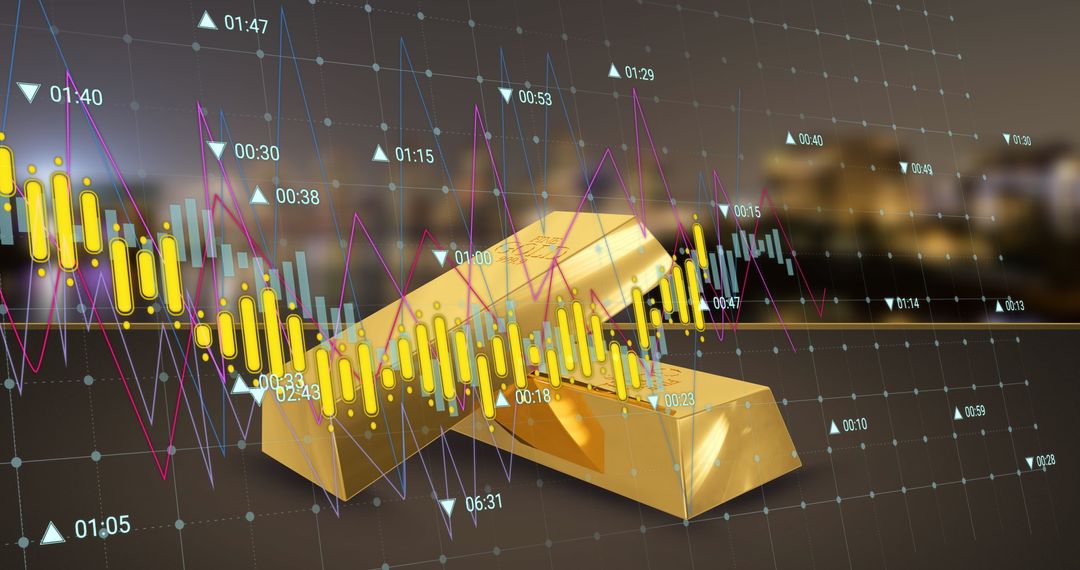
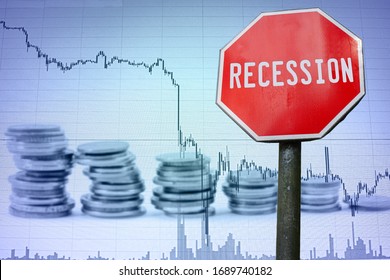
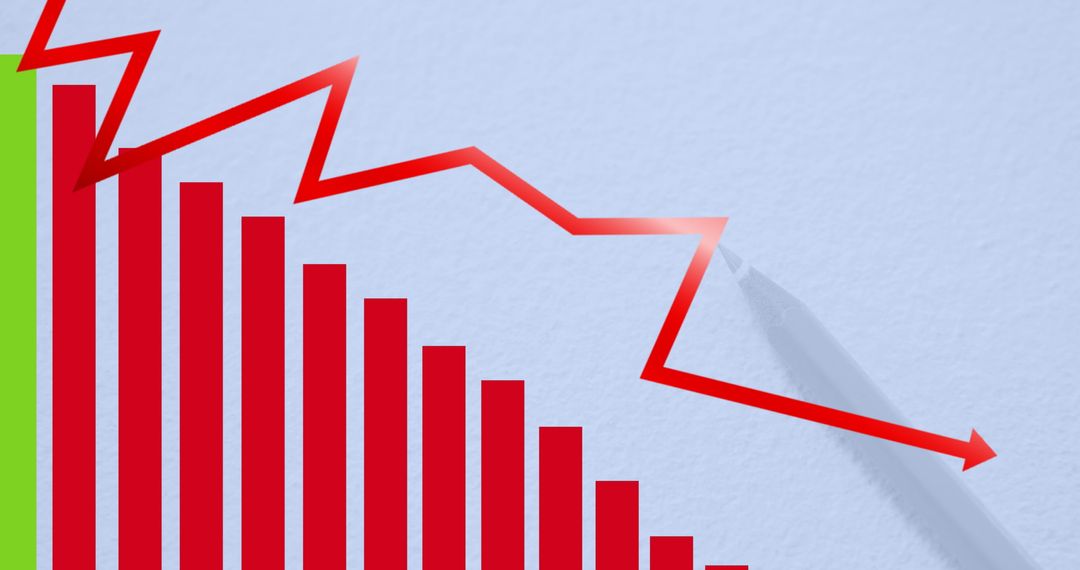
- Stacks of Coins with Economic Data Graph in Business Finance
Stacks of Coins with Economic Data Graph in Business Finance Image
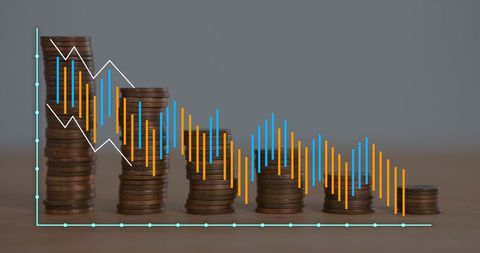
Collage of stacked coins with superimposed data graph illustrating economic trends or potential market downturn often used for discussions on financial analysis, forecasting global markets, or studying economic indicators. Ideal for presentations, financial reports, and educational material regarding business or investing.
Powered by  - Get 15% off with code: PIKWIZARD15


0
downloads
downloads
Tags:
More
Credit Photo
If you would like to credit the Photo, here are some ways you can do so
Text Link
photo Link
<span class="text-link">
<span>
<a target="_blank" href=https://pikwizard.com/photo/stacks-of-coins-with-economic-data-graph-in-business-finance/0349df3956dbdb8230516093d3518308/>PikWizard</a>
</span>
</span>
<span class="image-link">
<span
style="margin: 0 0 20px 0; display: inline-block; vertical-align: middle; width: 100%;"
>
<a
target="_blank"
href="https://pikwizard.com/photo/stacks-of-coins-with-economic-data-graph-in-business-finance/0349df3956dbdb8230516093d3518308/"
style="text-decoration: none; font-size: 10px; margin: 0;"
>
<img src="https://pikwizard.com/pw/medium/0349df3956dbdb8230516093d3518308.jpg" style="margin: 0; width: 100%;" alt="" />
<p style="font-size: 12px; margin: 0;">PikWizard</p>
</a>
</span>
</span>
Free (free of charge)
Free for personal and commercial use.
Author: People Creations
Similar Free Stock Images
Premium


Premium


Premium
Premium


Premium


Premium


Premium


Premium


Premium


Premium


Premium


Premium


Premium


Premium


Premium


Premium


Premium


Premium


Premium

Premium


Premium


Premium


Premium


Premium

