- Home >
- Stock Photos >
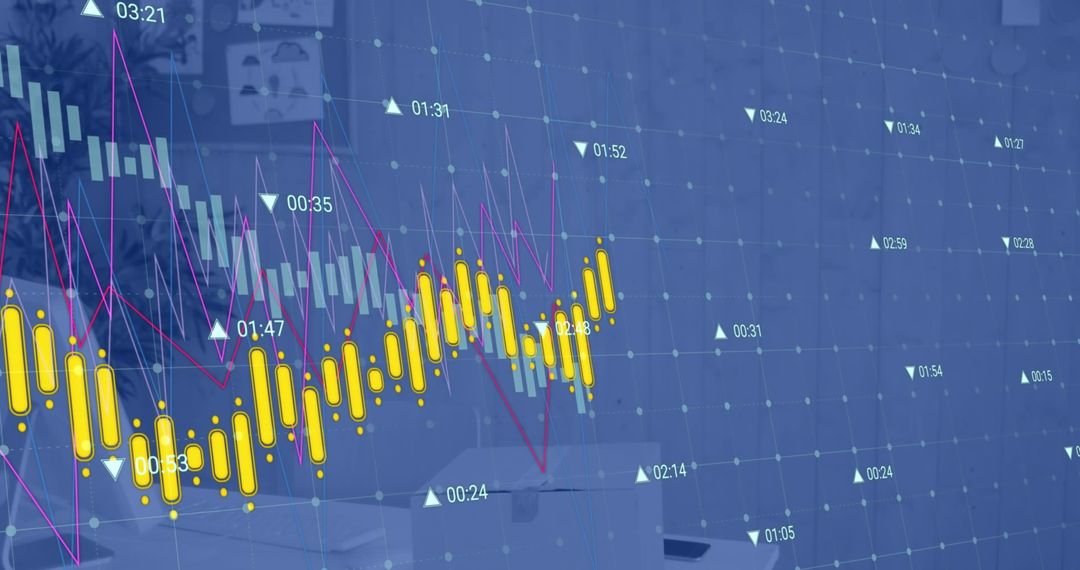
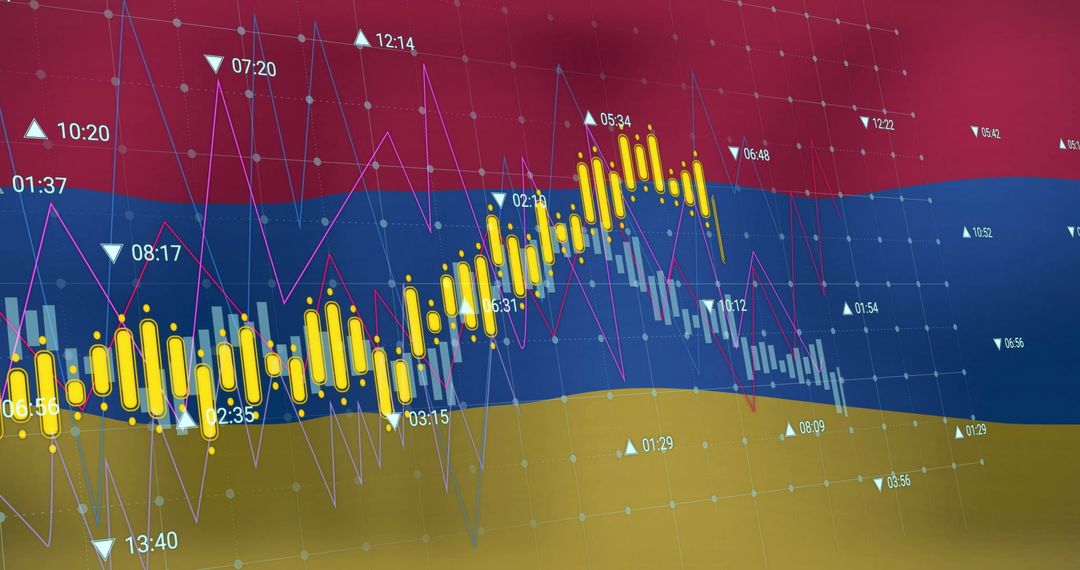
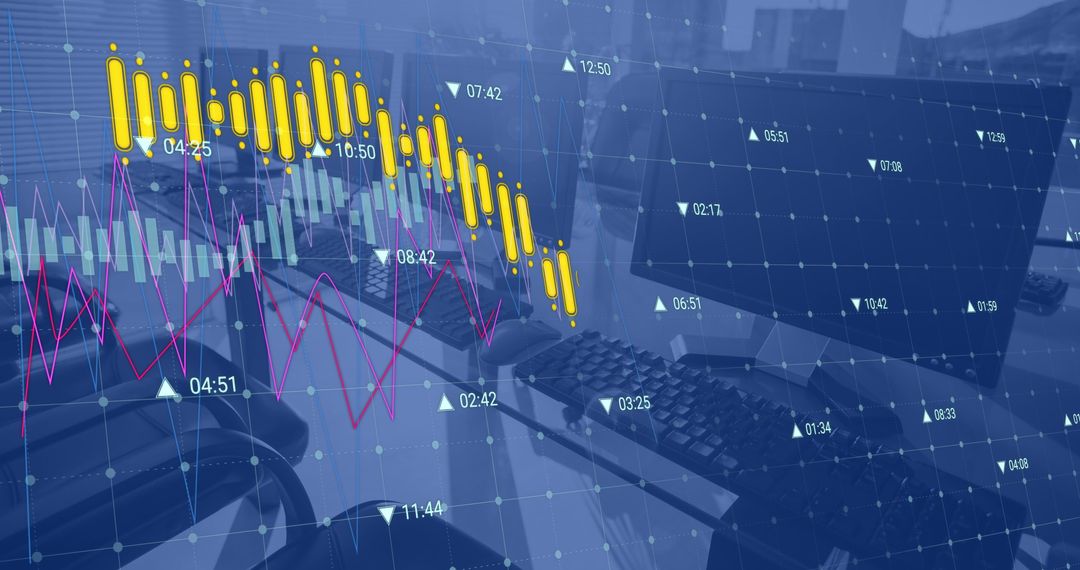
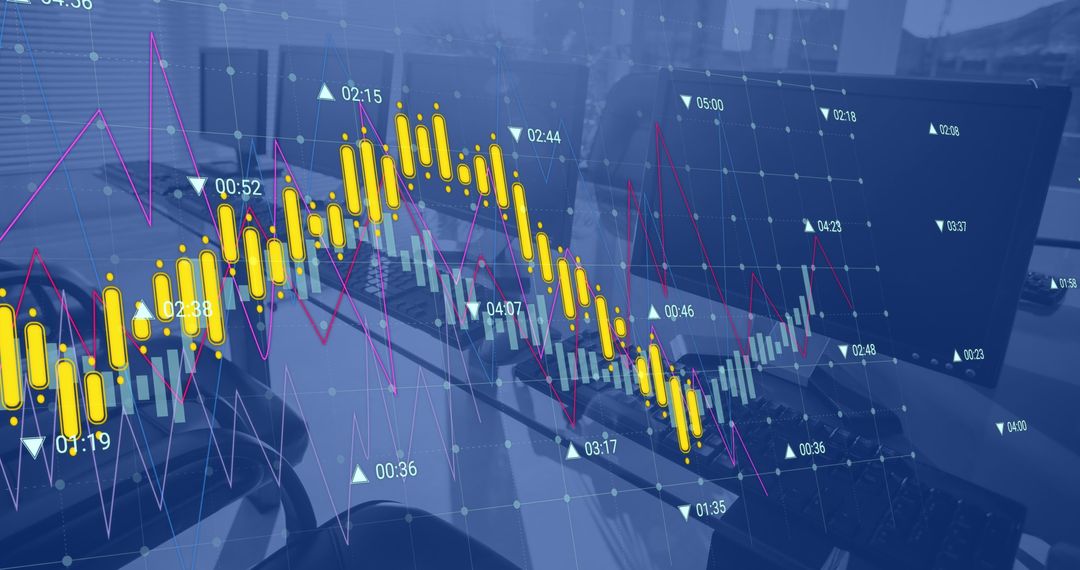
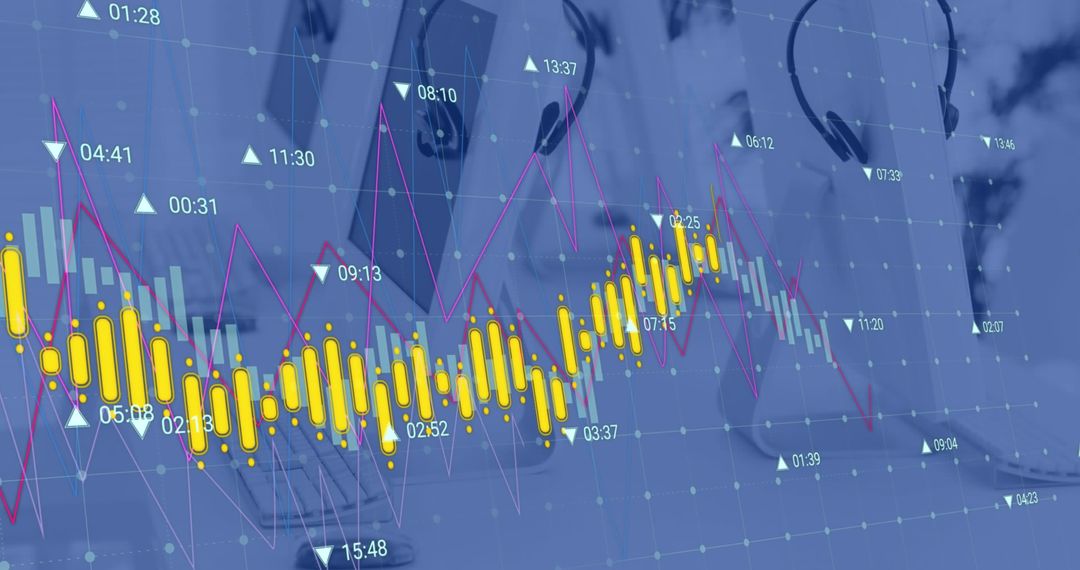
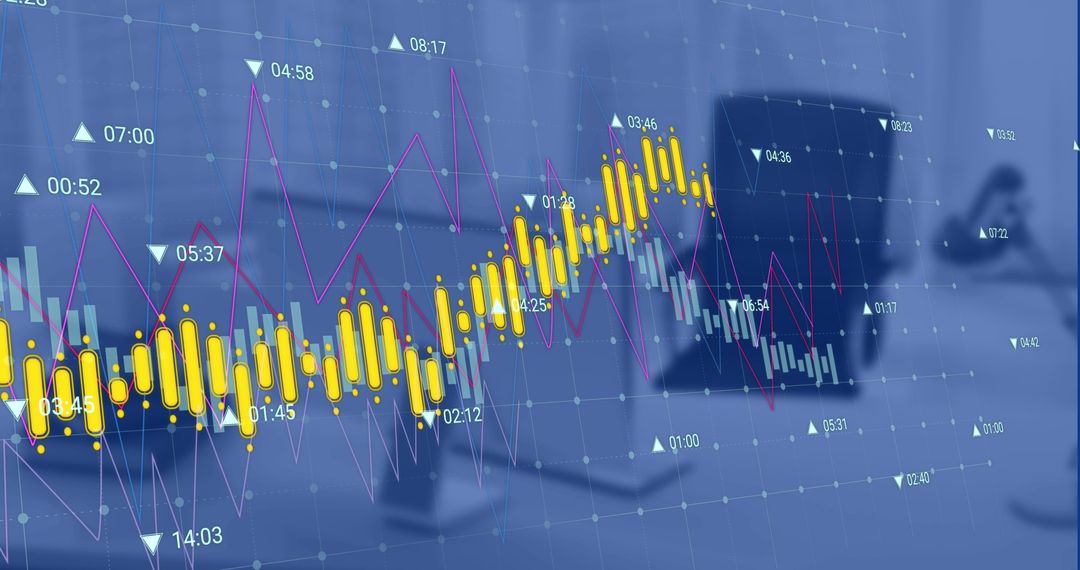
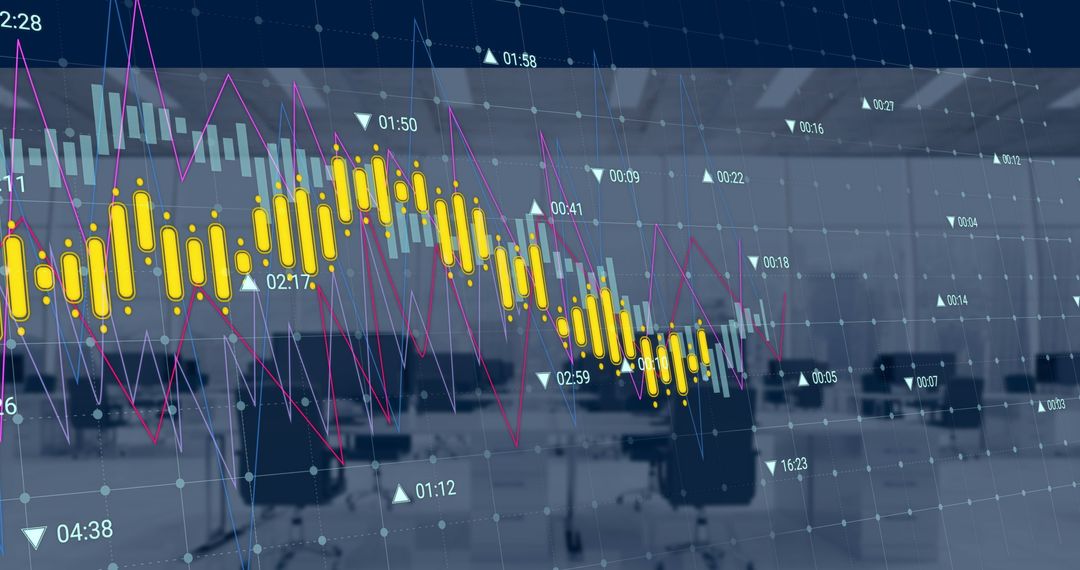
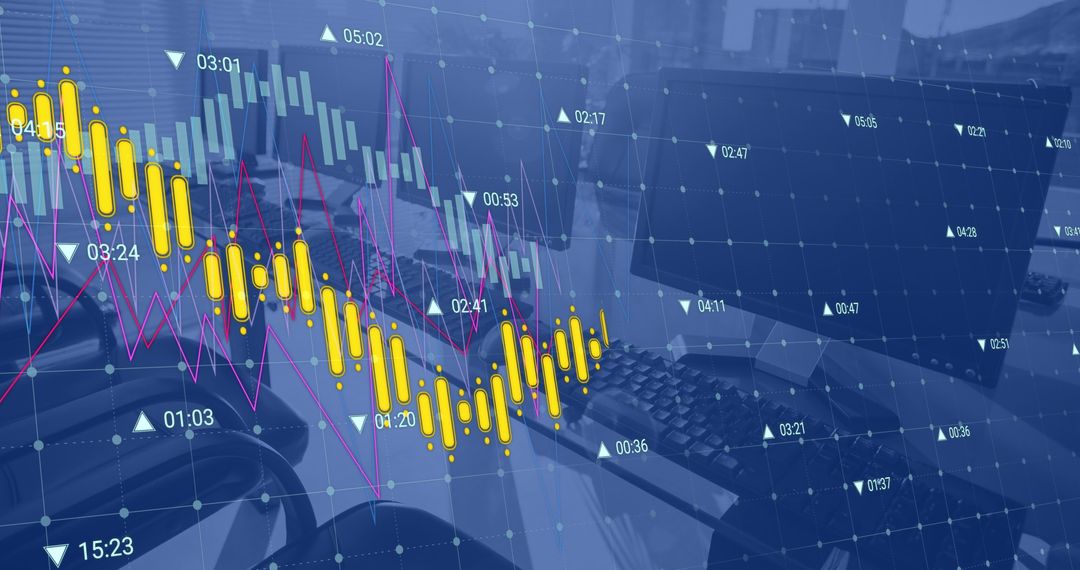
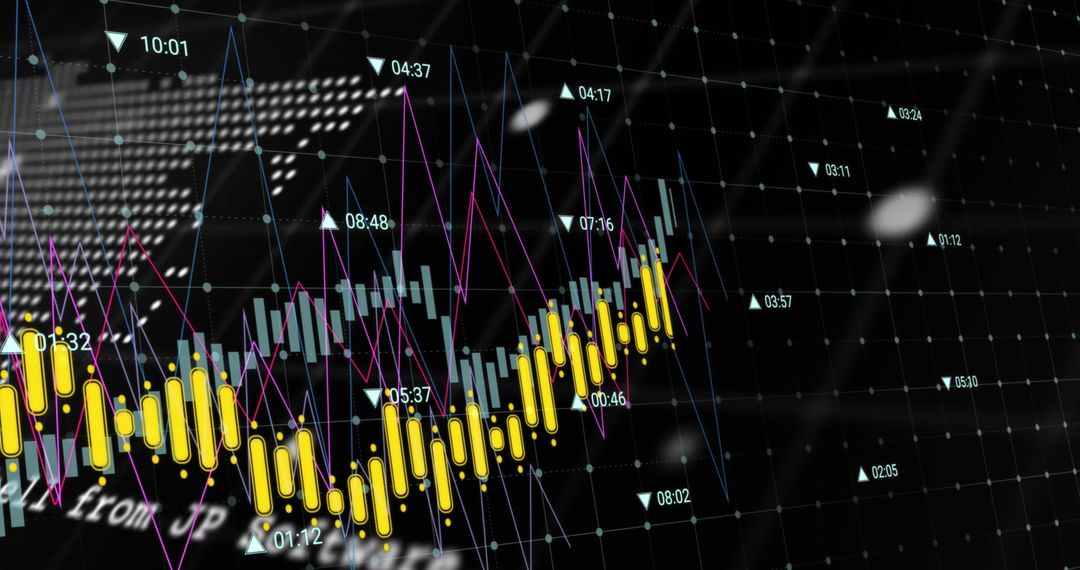
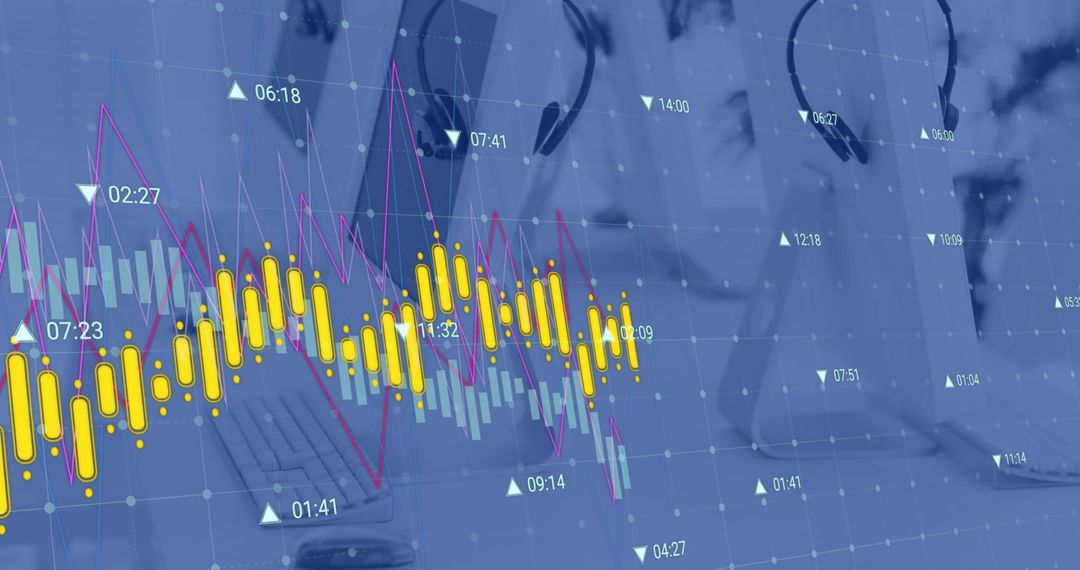
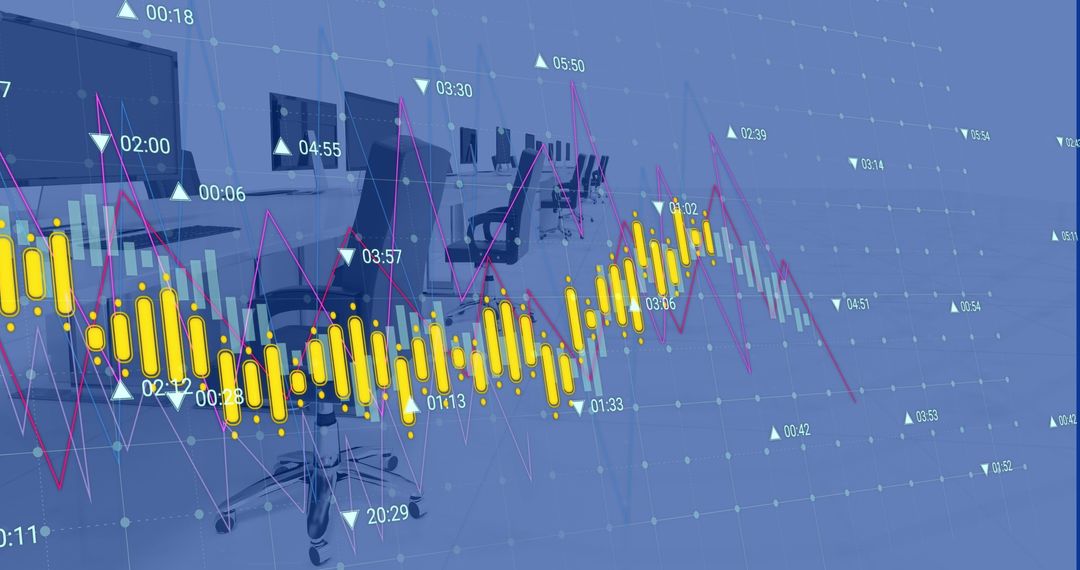
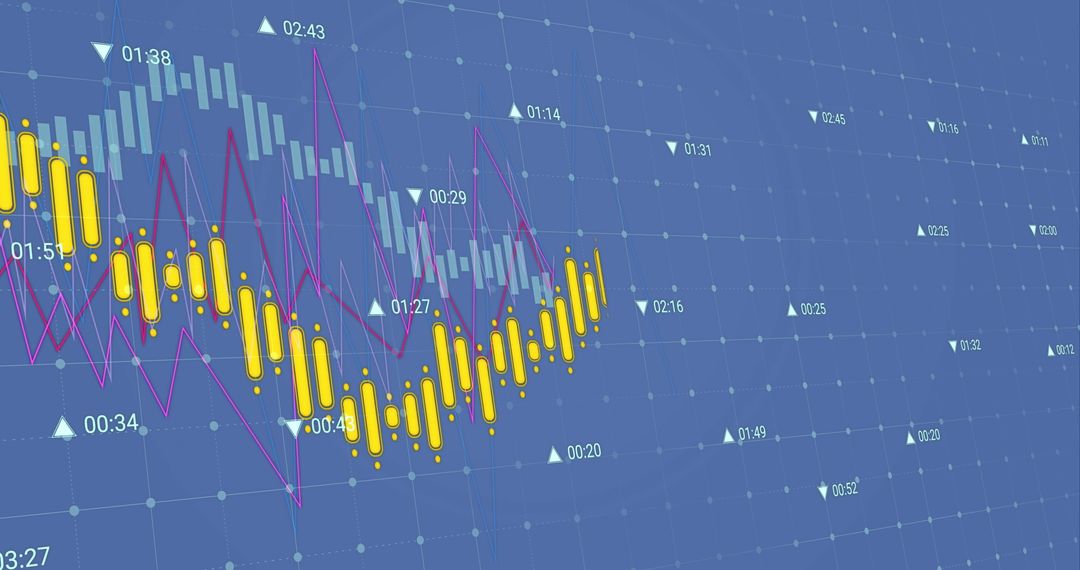
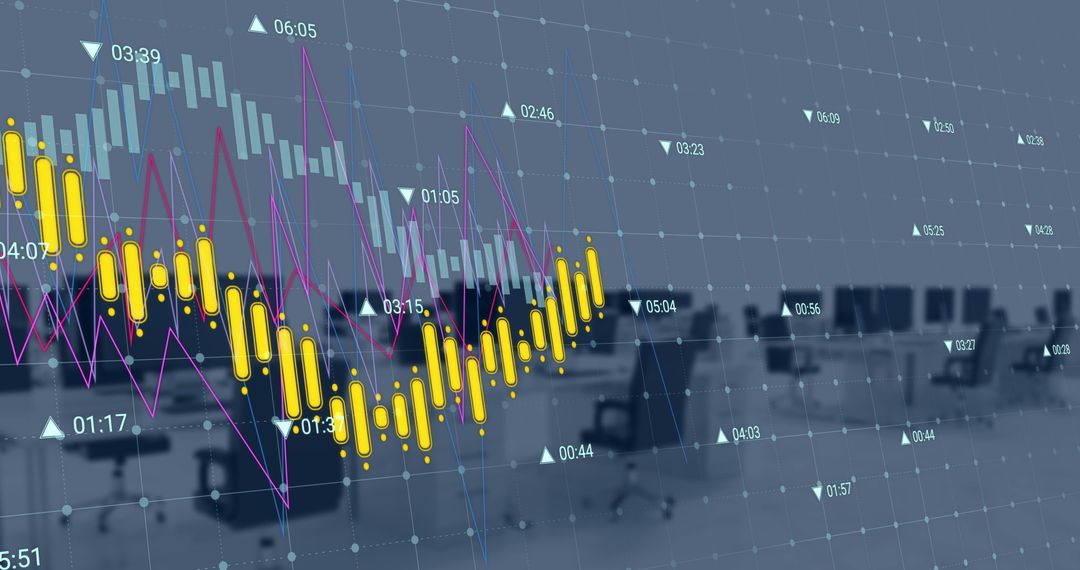
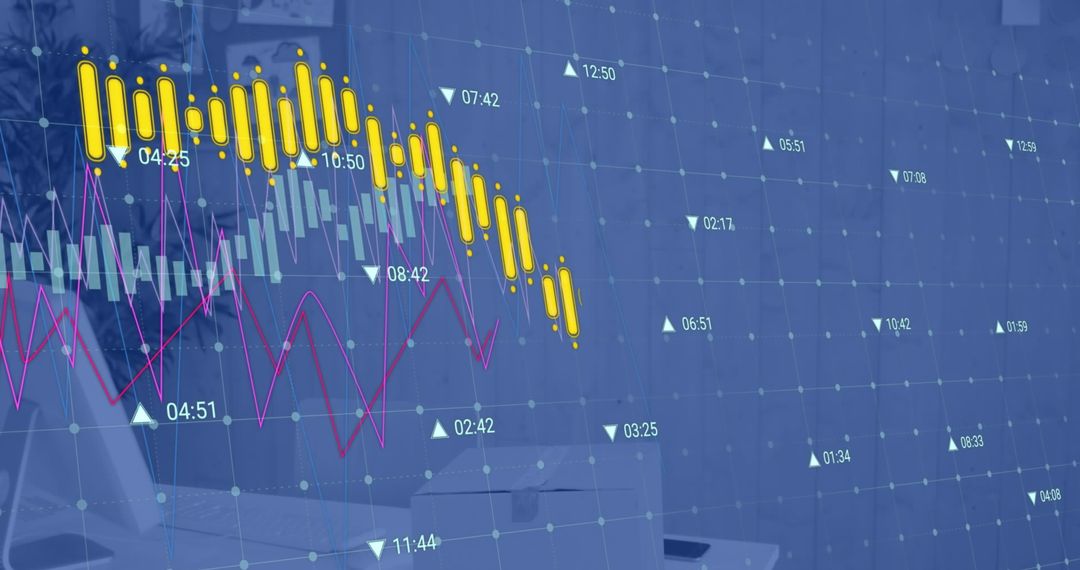
- Stock Market Analysis Concept with Digital Data Over Desk
Stock Market Analysis Concept with Digital Data Over Desk Image
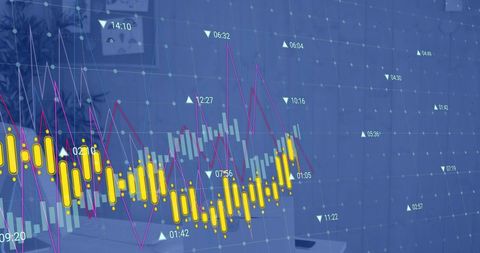
Scene shows financial data overlaid on a stylized office backdrop, featuring bright graphs and data points. Highlights global financial analytics and its integration with everyday work scenes. Ideal for finance, business planning, stock market education, or financial blog visuals conveying a modern, high-tech approach.
Powered by  - Get 15% off with code: PIKWIZARD15


2
downloads
downloads
Tags:
More
Credit Photo
If you would like to credit the Photo, here are some ways you can do so
Text Link
photo Link
<span class="text-link">
<span>
<a target="_blank" href=https://pikwizard.com/photo/stock-market-analysis-concept-with-digital-data-over-desk/2ee1209aad71e168200c092fa64b6237/>PikWizard</a>
</span>
</span>
<span class="image-link">
<span
style="margin: 0 0 20px 0; display: inline-block; vertical-align: middle; width: 100%;"
>
<a
target="_blank"
href="https://pikwizard.com/photo/stock-market-analysis-concept-with-digital-data-over-desk/2ee1209aad71e168200c092fa64b6237/"
style="text-decoration: none; font-size: 10px; margin: 0;"
>
<img src="https://pikwizard.com/pw/medium/2ee1209aad71e168200c092fa64b6237.jpg" style="margin: 0; width: 100%;" alt="" />
<p style="font-size: 12px; margin: 0;">PikWizard</p>
</a>
</span>
</span>
Free (free of charge)
Free for personal and commercial use.
Author: Awesome Content
Similar Free Stock Images

Premium


Premium


Premium


Premium


Premium


Premium


Premium


Premium


Premium


Premium


Premium


Premium


Premium


Premium


Premium


Premium


Premium


Premium


Premium


Premium


Premium


Premium


Premium


Premium


Premium