- Home >
- Stock Photos >
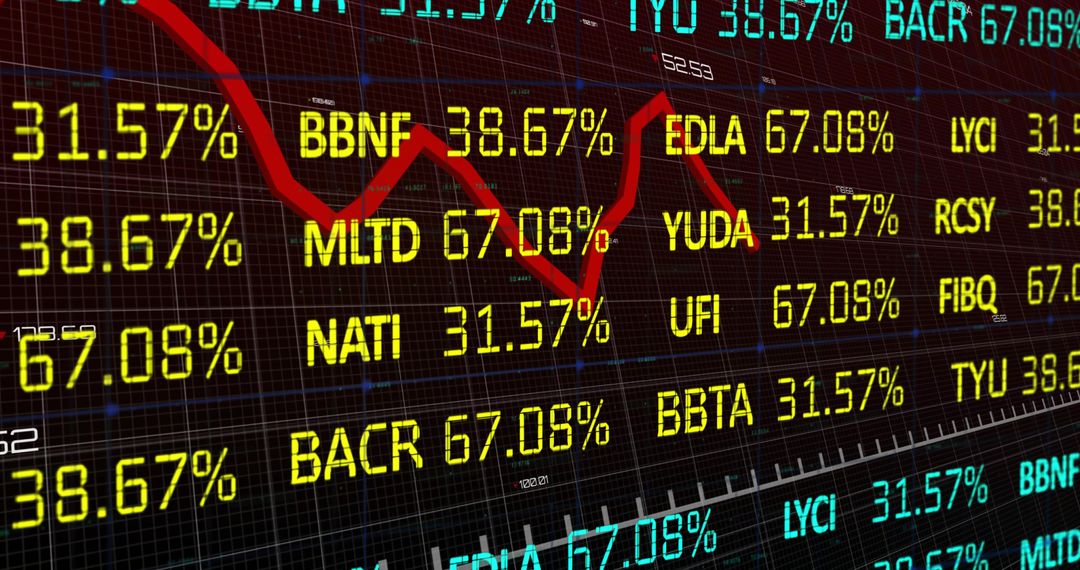
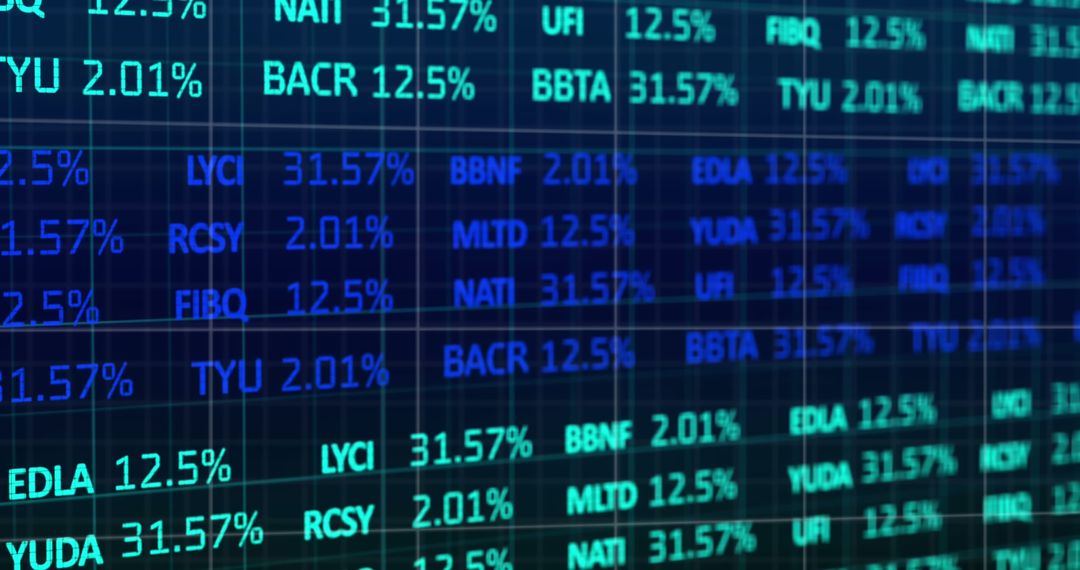
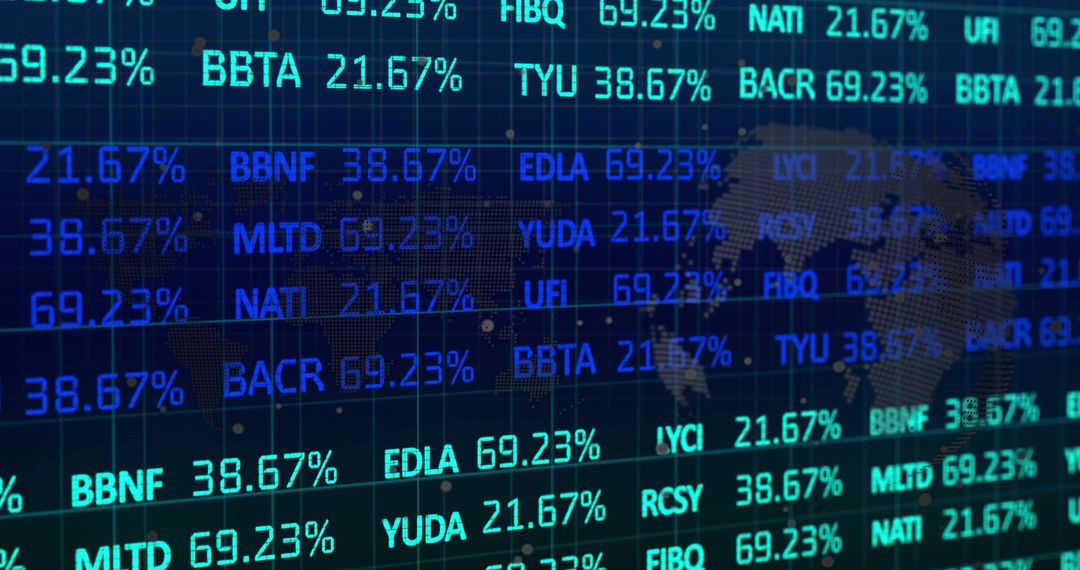
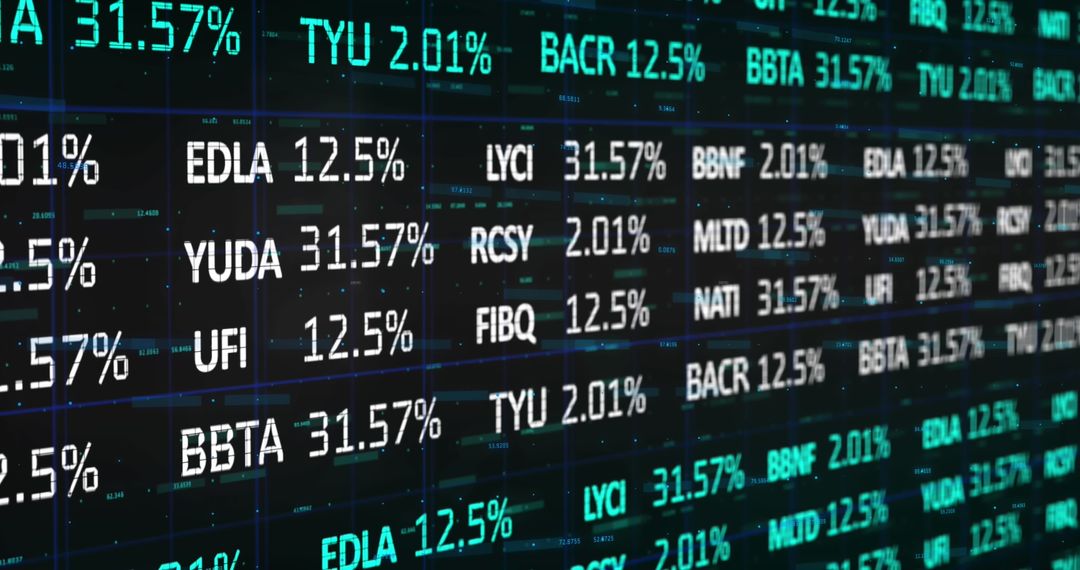
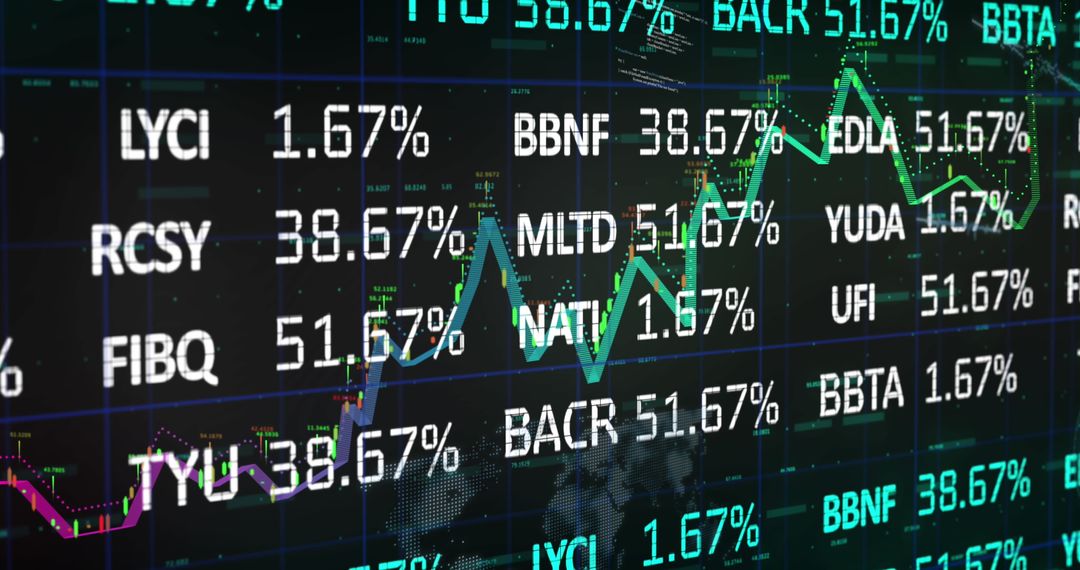
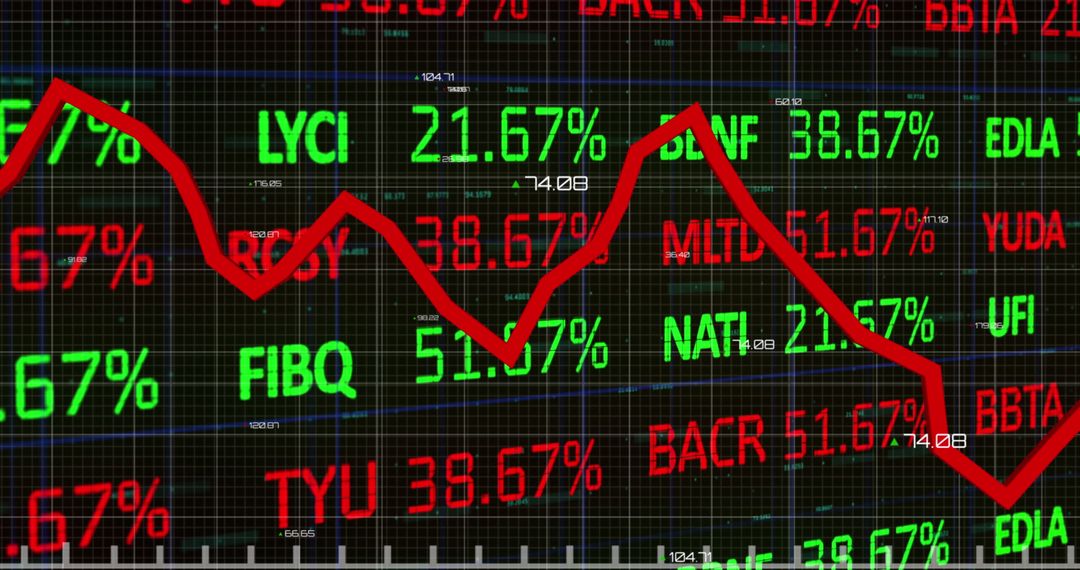
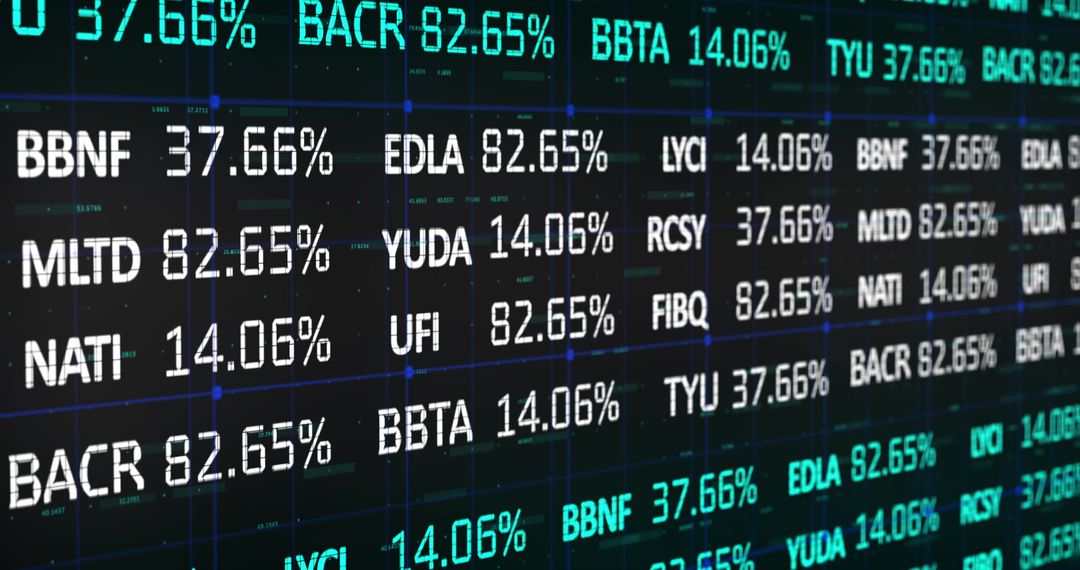
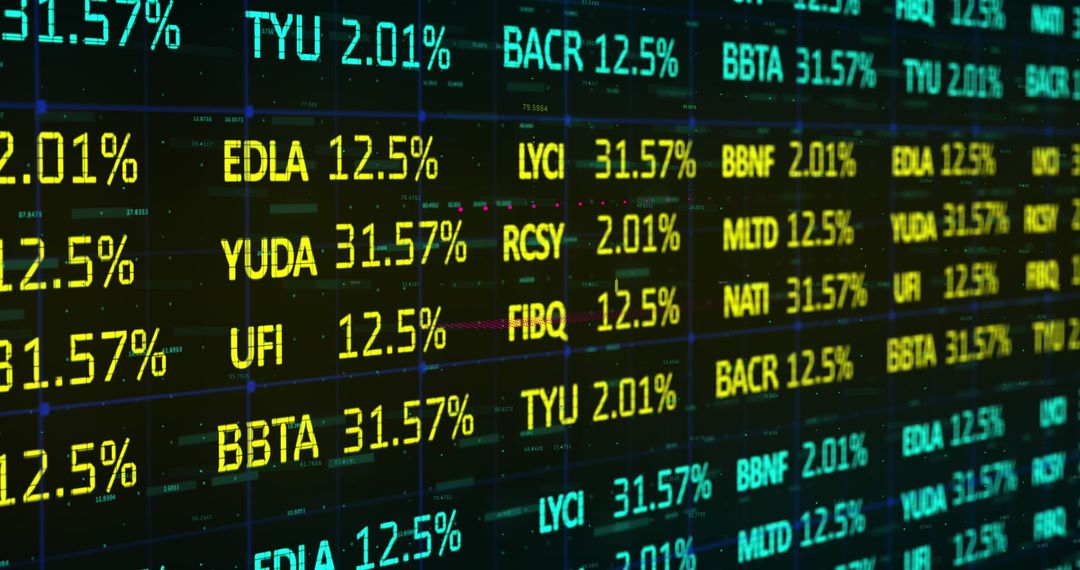
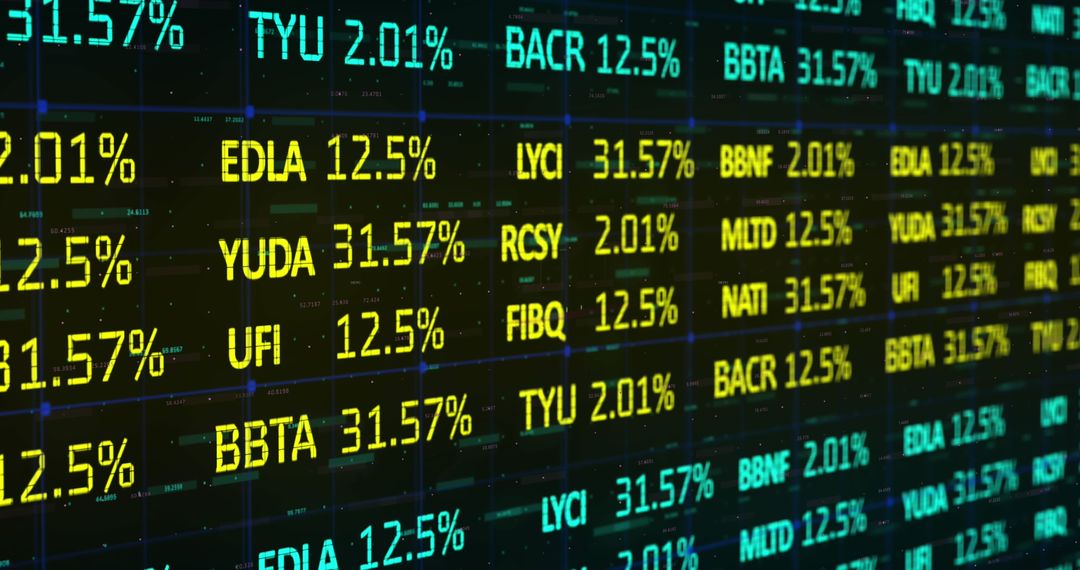
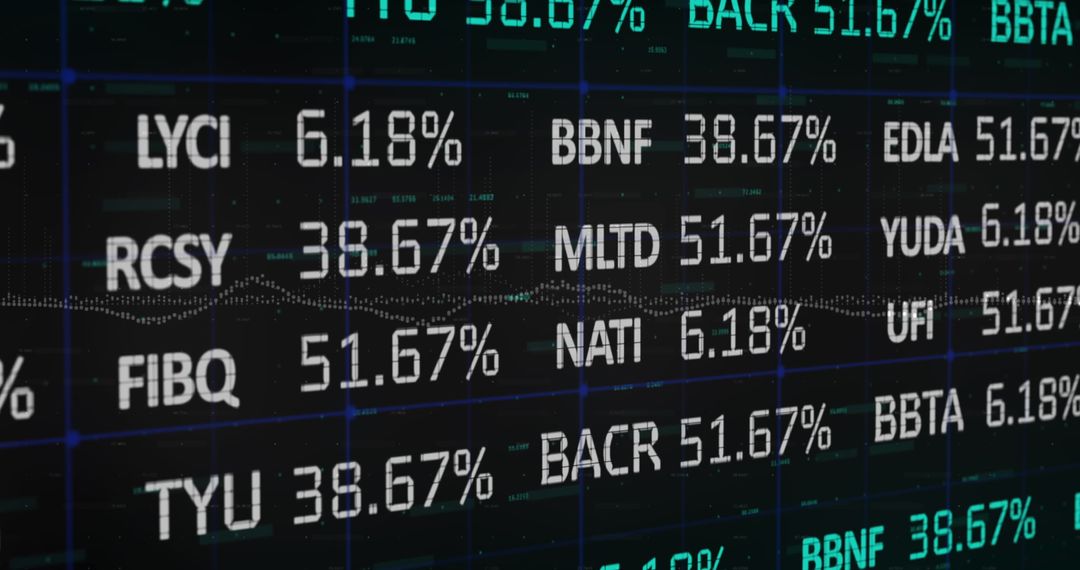
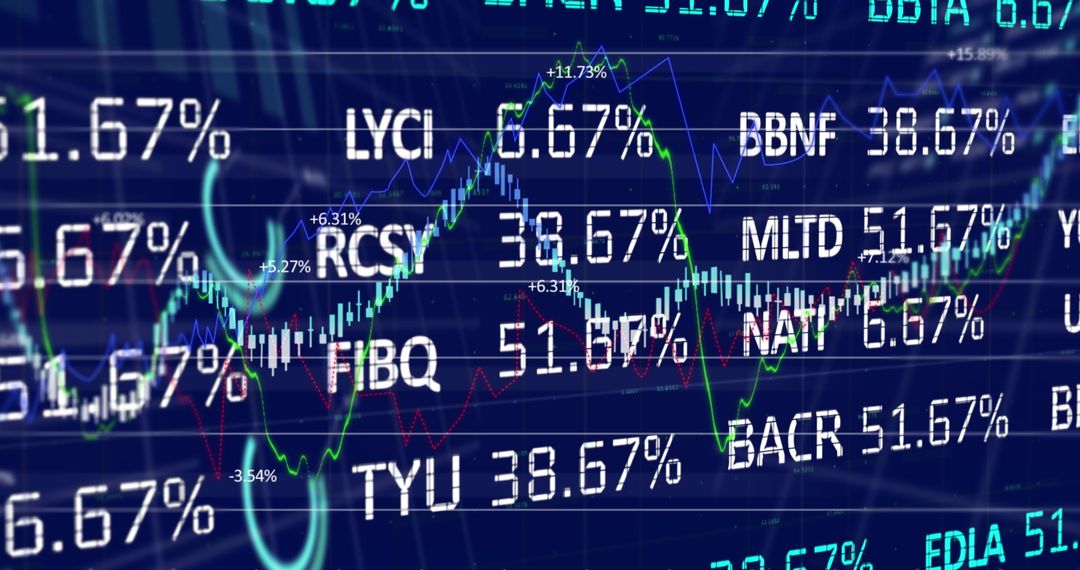
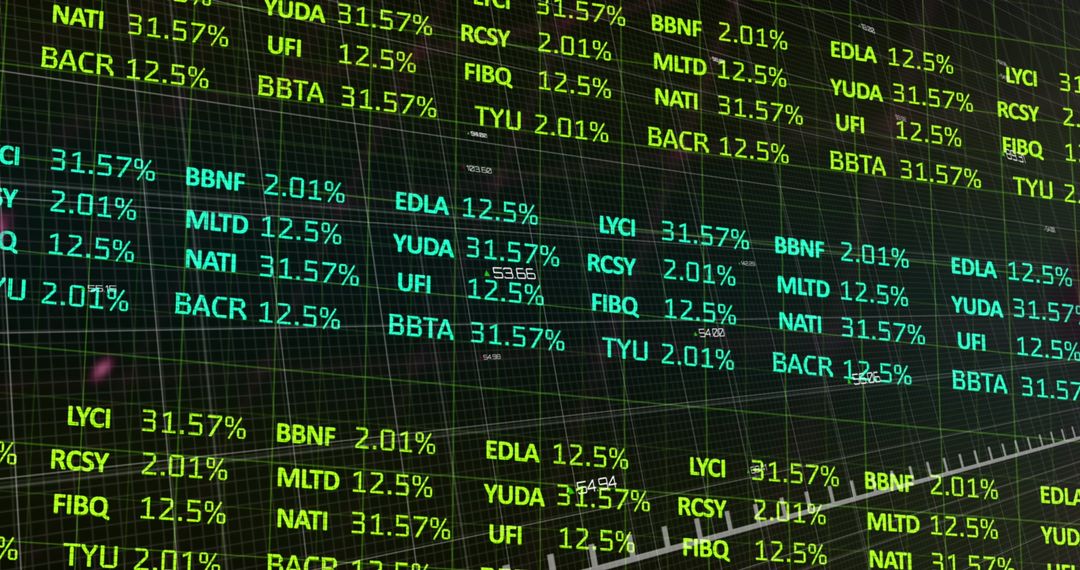
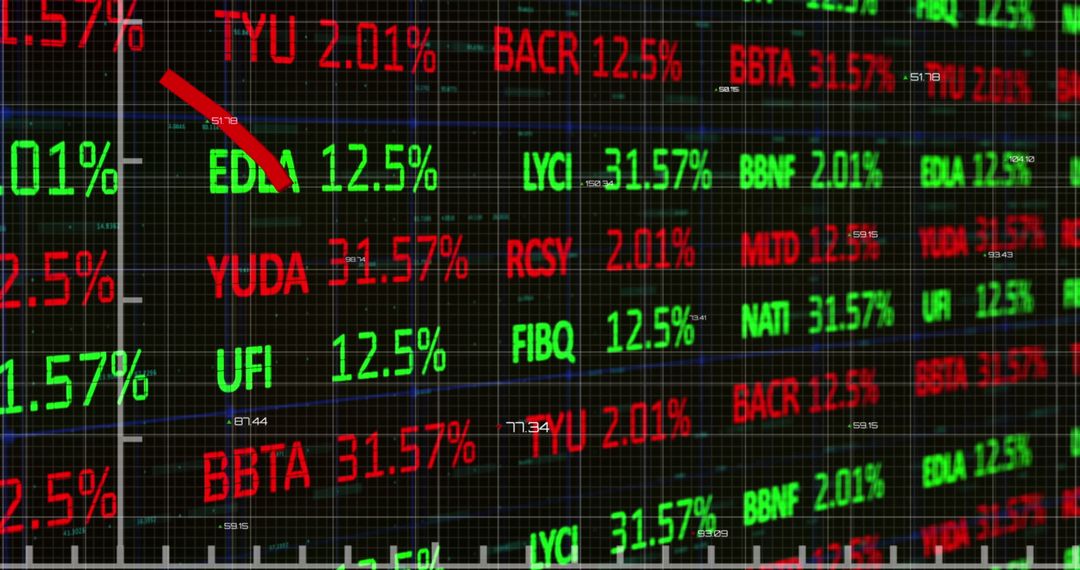
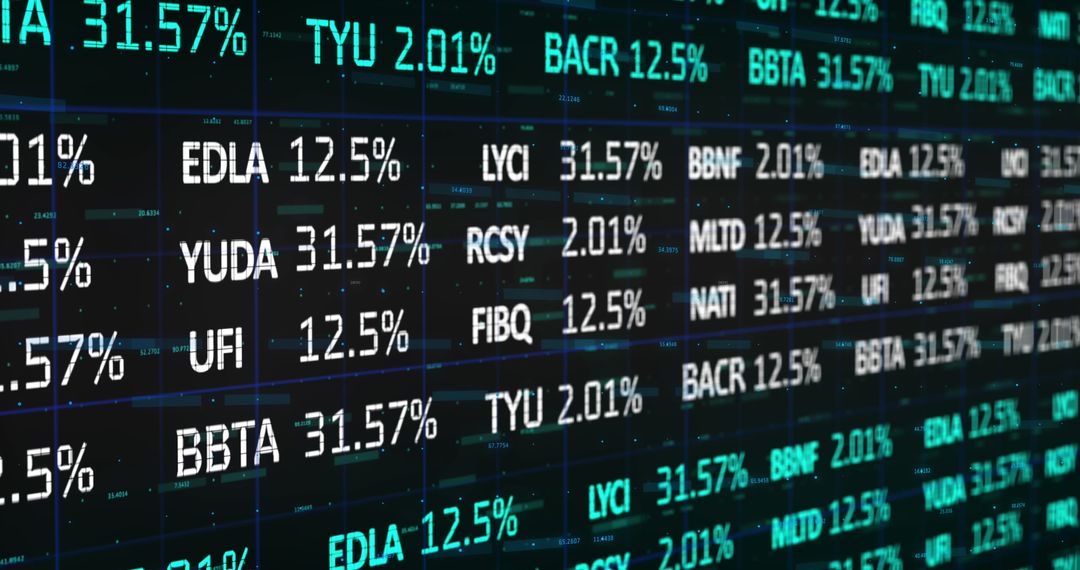
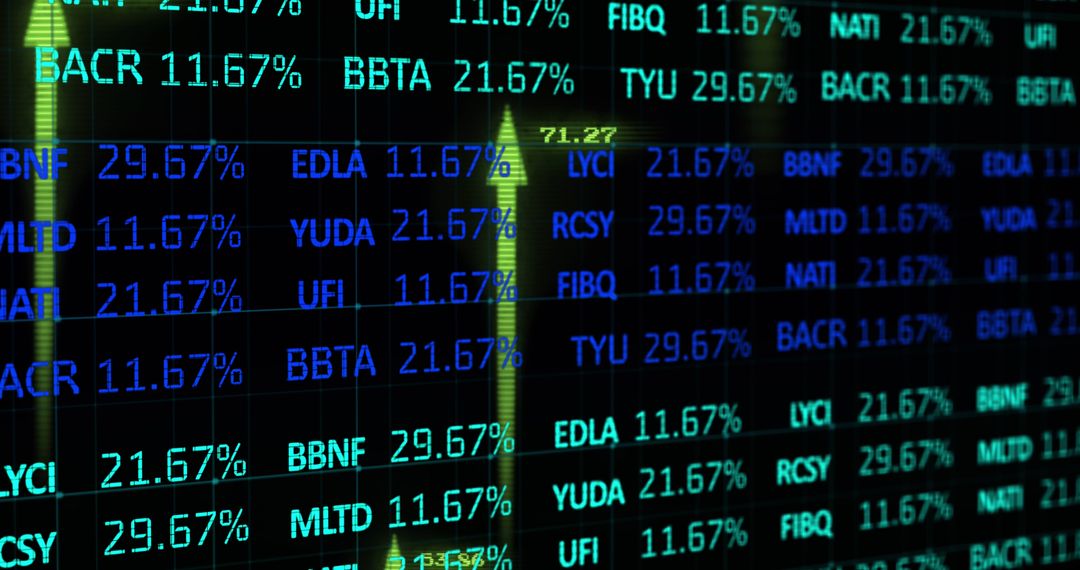
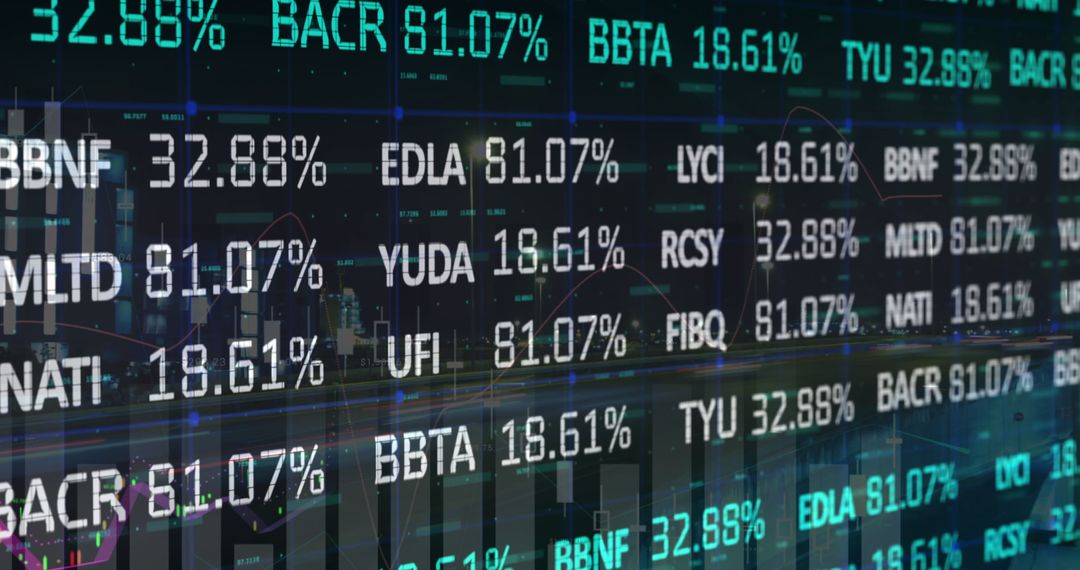
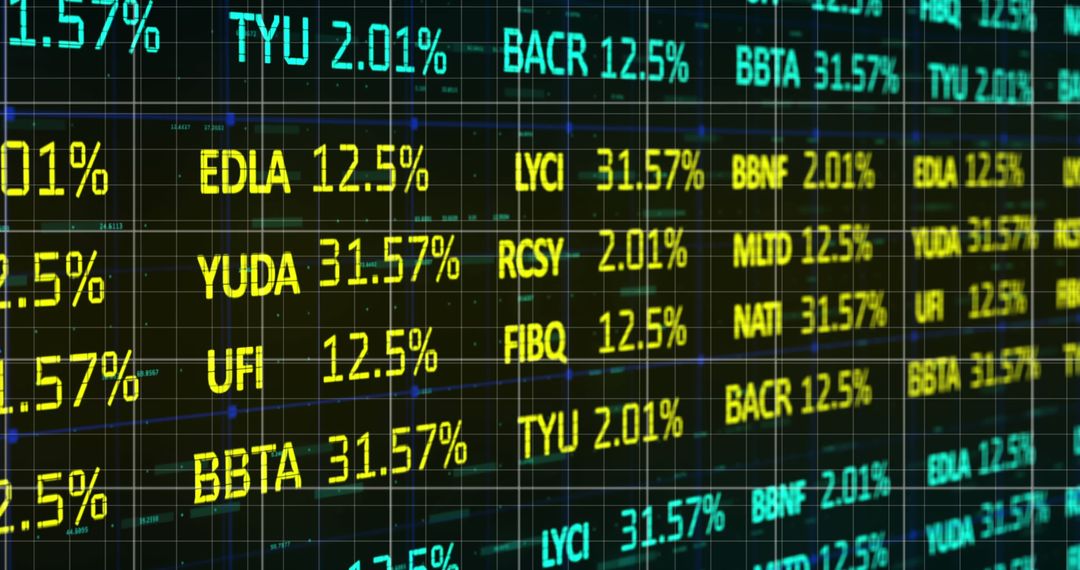
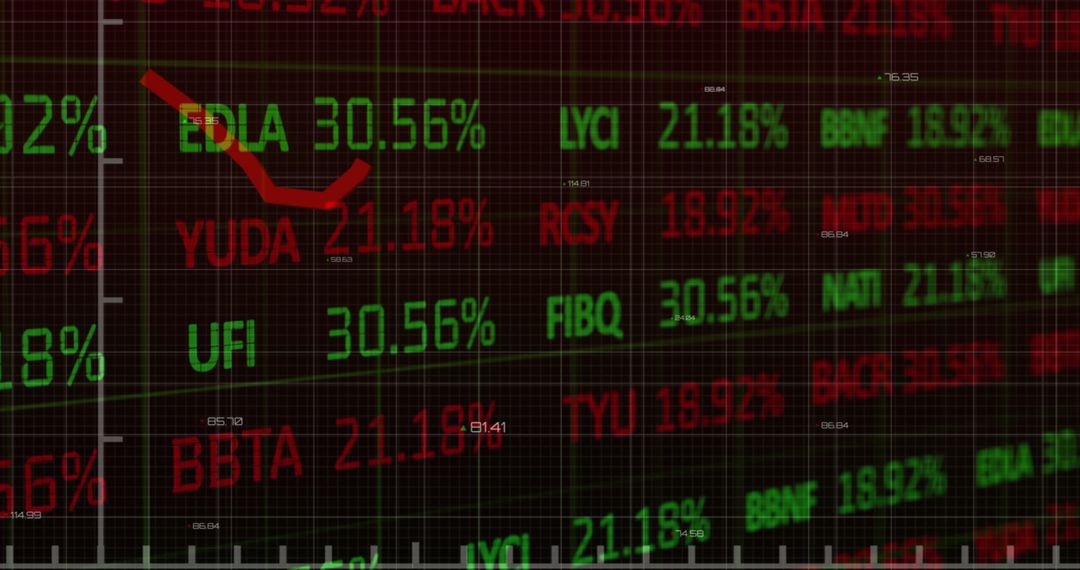
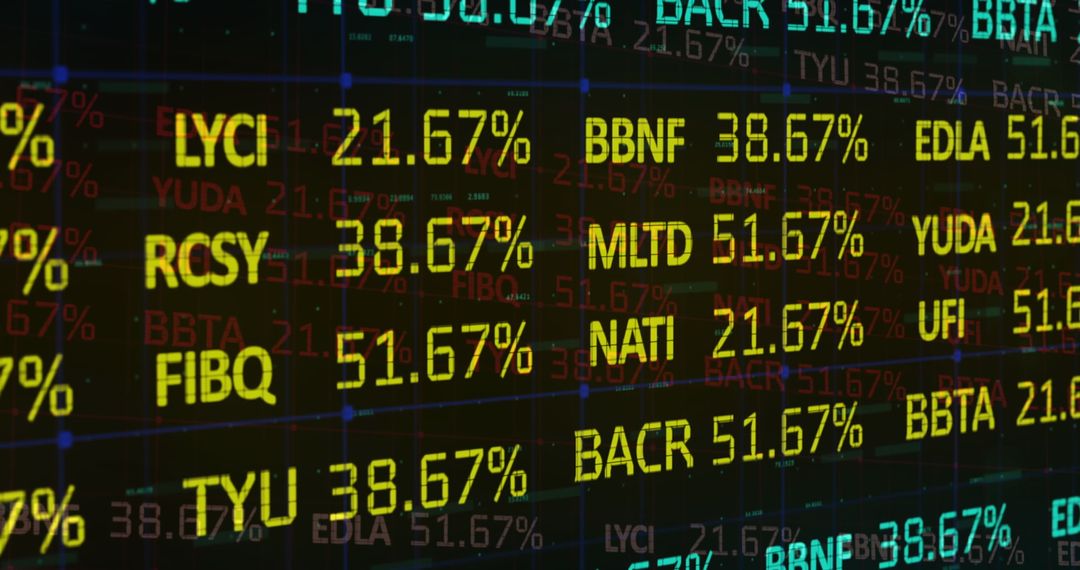
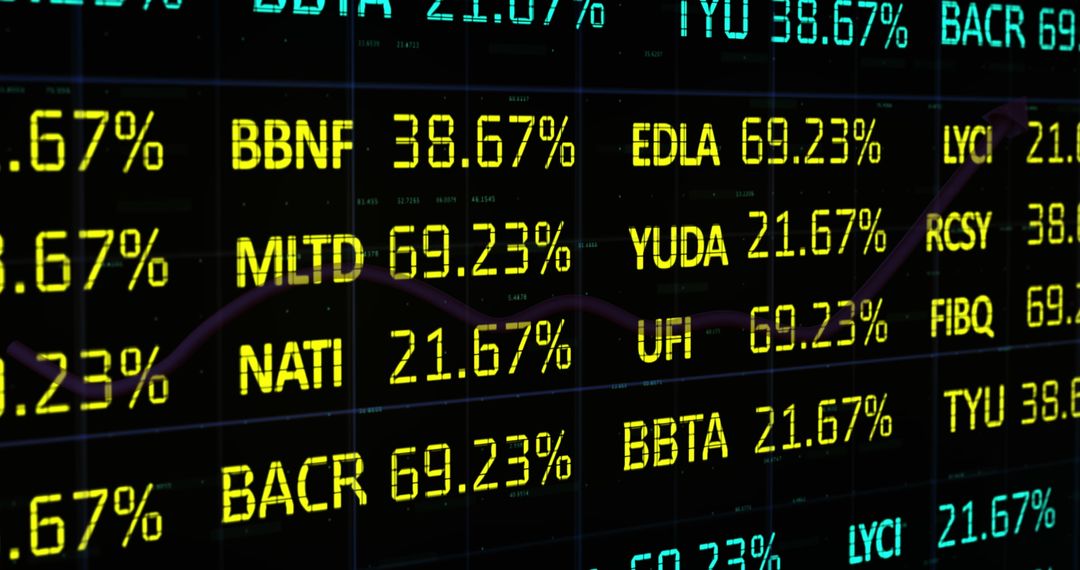
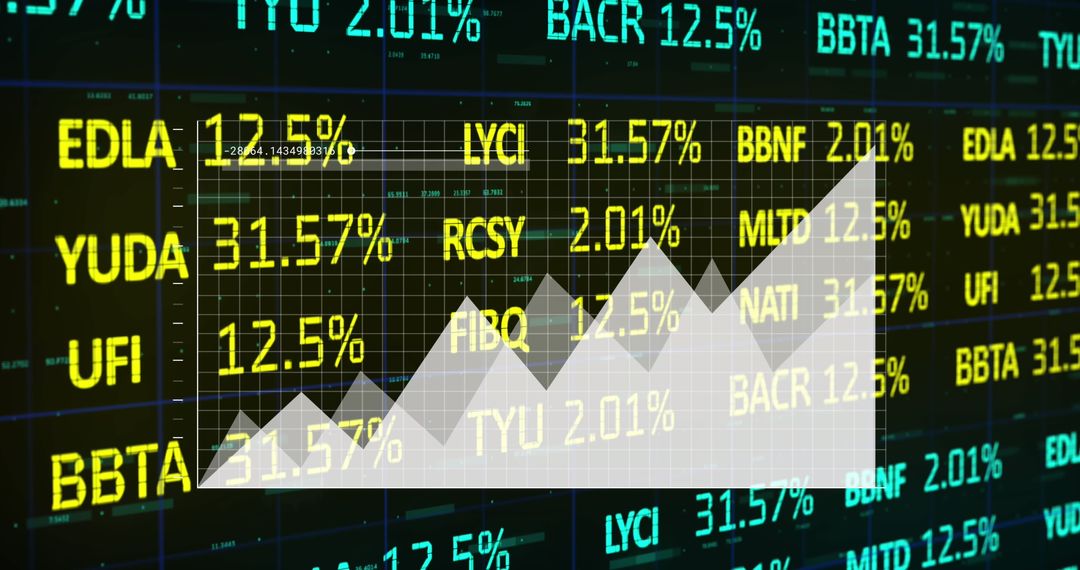
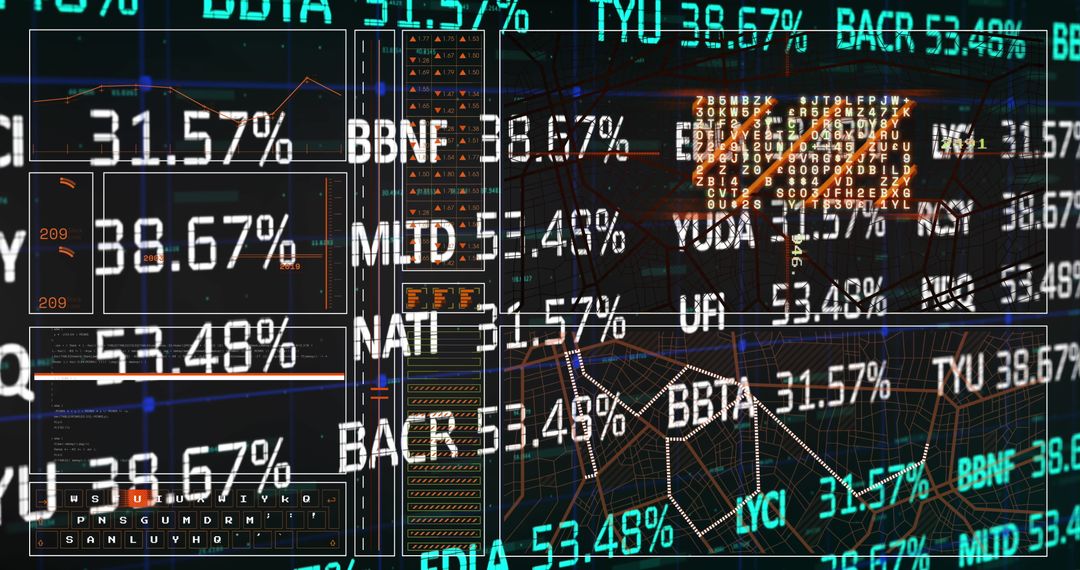
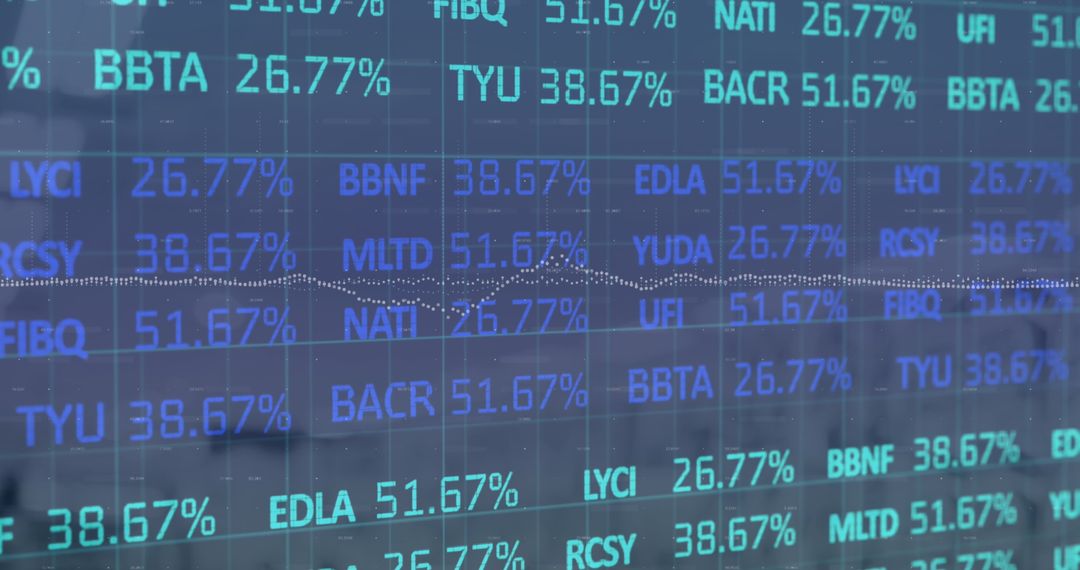
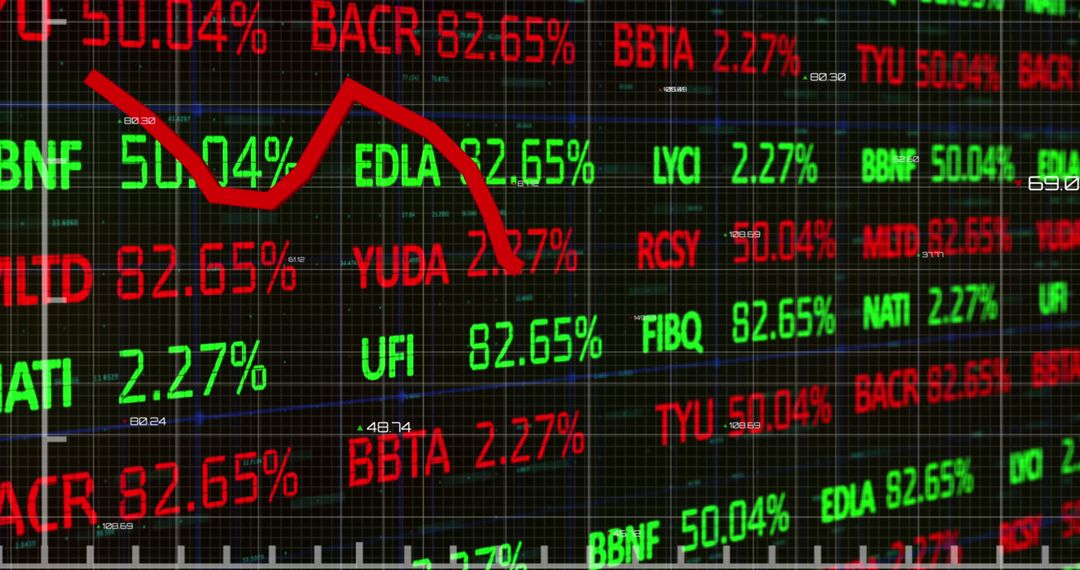
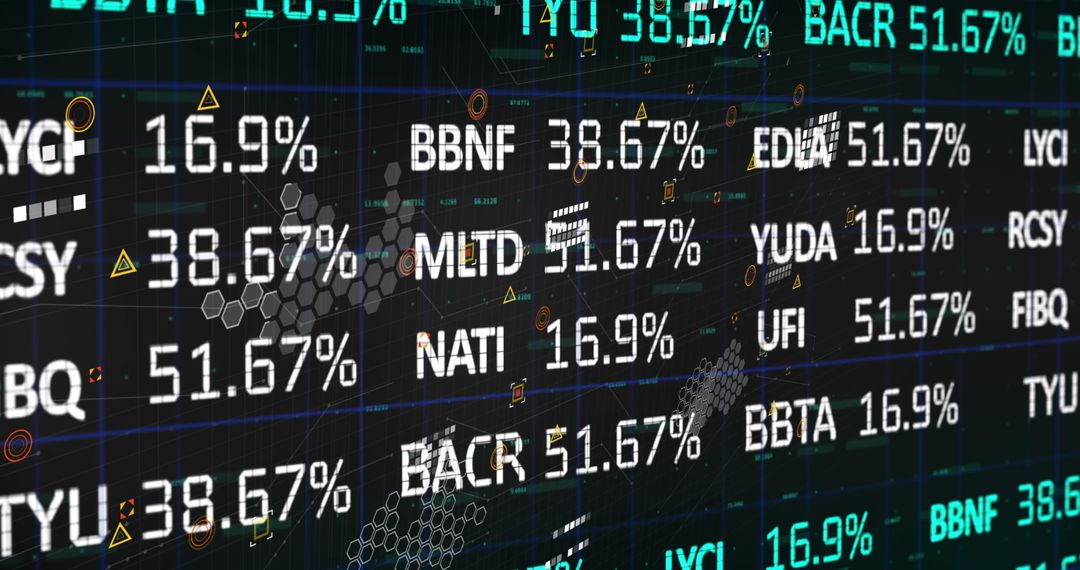
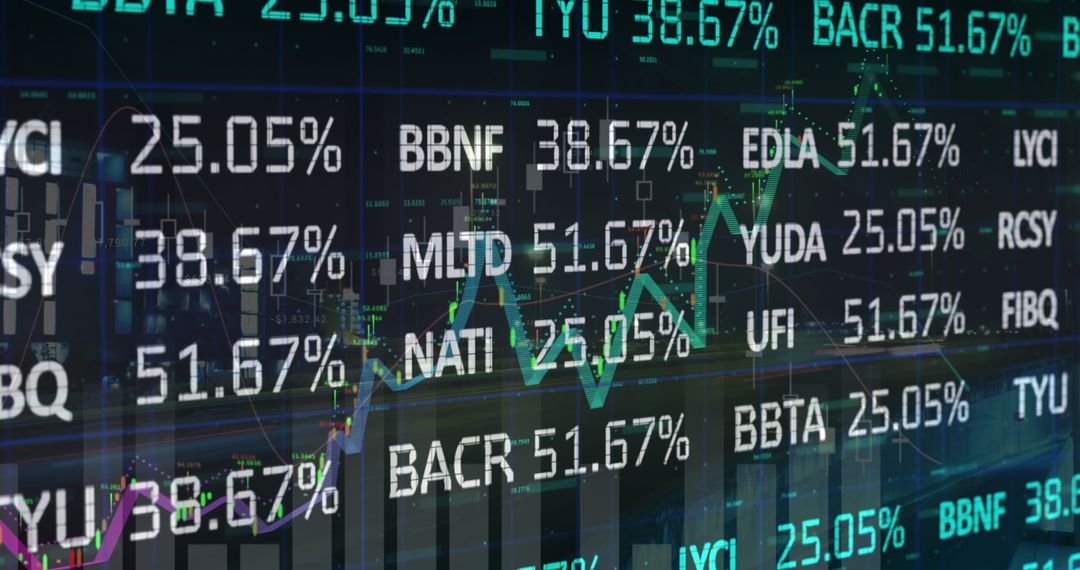
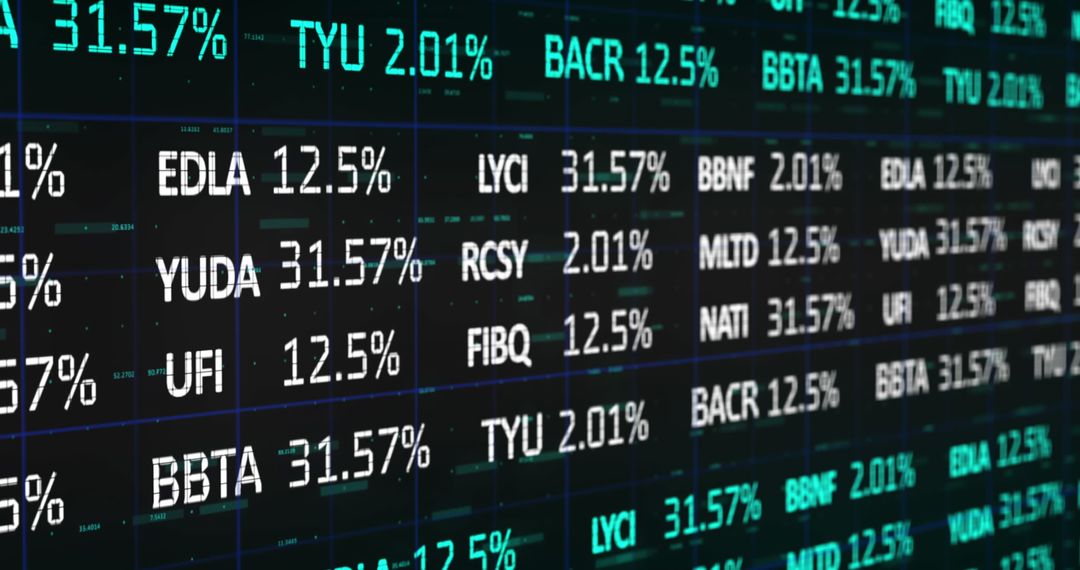
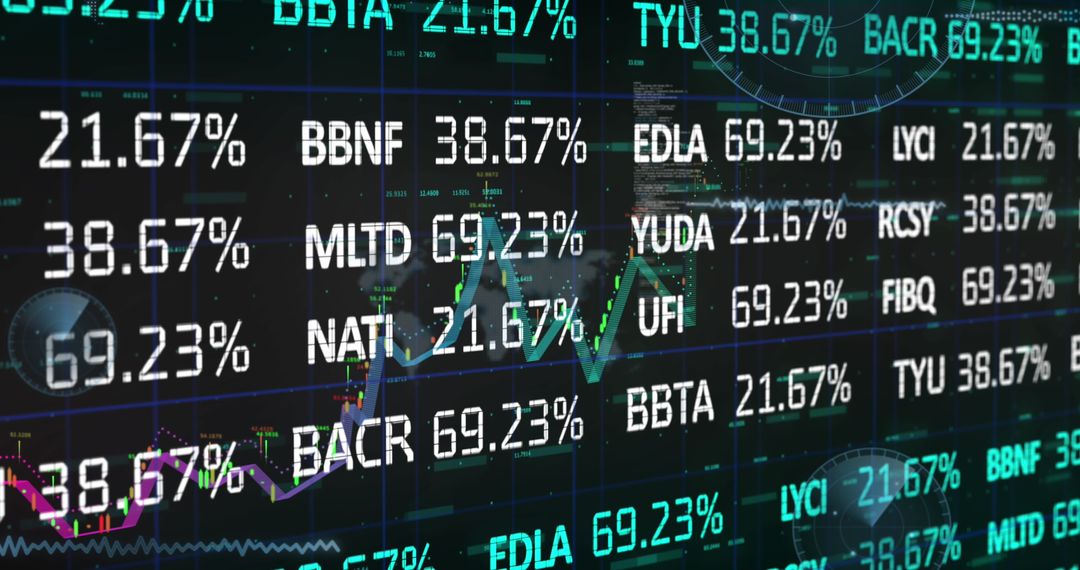
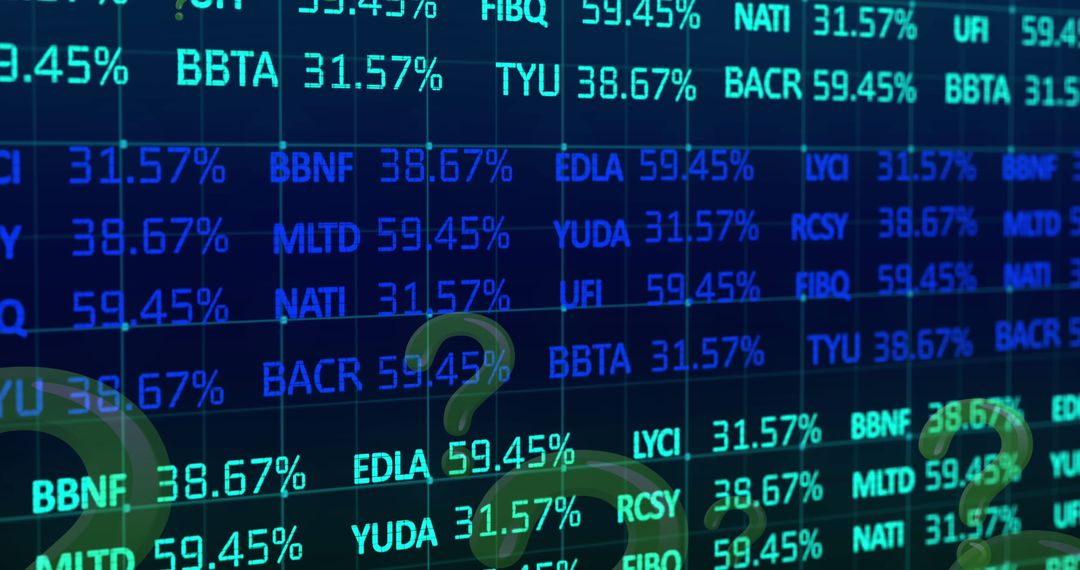
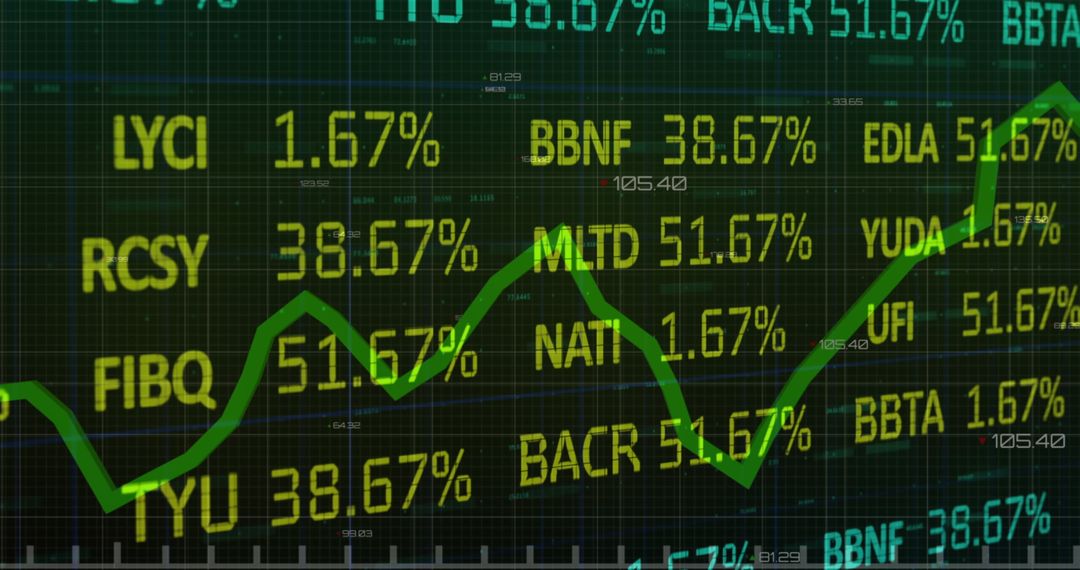
- Stock Market Analysis with Financial Data Indicators
Stock Market Analysis with Financial Data Indicators Image

Stock trading and analysis in progress, displaying percentage gains and losses from various companies on digital finance board. General uptrend indicated by green arrow emphasizes focus on rising financial analytics. Useful for topics about stock trading, financial analysis, investment strategies, and digital finance technology.
Powered by 


2
downloads
downloads
Tags:
More
Credit Photo
If you would like to credit the Photo, here are some ways you can do so
Text Link
photo Link
<span class="text-link">
<span>
<a target="_blank" href=https://pikwizard.com/photo/stock-market-analysis-with-financial-data-indicators/8a1dbb6857f06b5fe9a6154a398cd9ff/>PikWizard</a>
</span>
</span>
<span class="image-link">
<span
style="margin: 0 0 20px 0; display: inline-block; vertical-align: middle; width: 100%;"
>
<a
target="_blank"
href="https://pikwizard.com/photo/stock-market-analysis-with-financial-data-indicators/8a1dbb6857f06b5fe9a6154a398cd9ff/"
style="text-decoration: none; font-size: 10px; margin: 0;"
>
<img src="https://pikwizard.com/pw/medium/8a1dbb6857f06b5fe9a6154a398cd9ff.jpg" style="margin: 0; width: 100%;" alt="" />
<p style="font-size: 12px; margin: 0;">PikWizard</p>
</a>
</span>
</span>
Free (free of charge)
Free for personal and commercial use.
Author: Authentic Images
Similar Free Stock Images
Premium


Premium


Premium


Premium


Premium


Premium


Premium


Premium


Premium

Premium


Premium

Premium


Premium


Premium


Premium


Premium


Premium


Premium


Premium

Premium


Premium


Premium


Premium


Premium