1. Home > 
  2. Stock Photos > 
  3. Stock Market Analysis with Multi-Layer Graphs and Charts

Stock Market Analysis with Multi-Layer Graphs and Charts Image

Stock Market Analysis with Multi-Layer Graphs and Charts

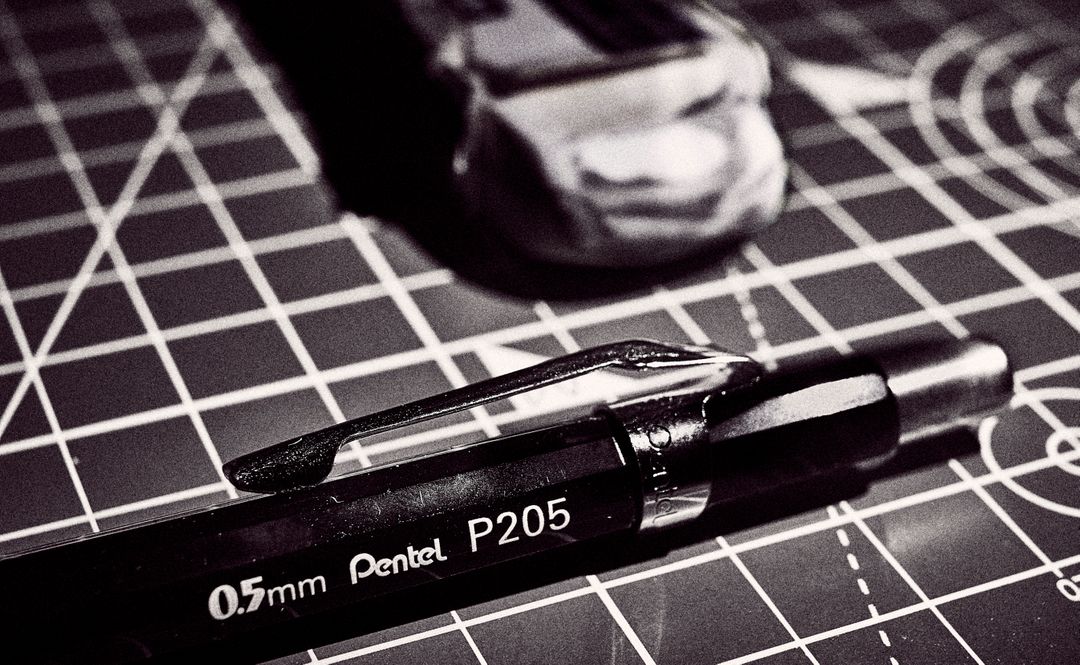
This image combines elements of stock market trading with multiple graphs and a trading board, layered over a pen and notepad. Suitable for illustrating articles and reports on finance, stock analysis, and economic trends. It is also perfect for presentations on business strategy, data analytics, and market projections.

Powered by Shutterstock logo - Get 15% off with code: PIKWIZARD15
businessman hand working with new modern computer and business strategy as concept - Powered by Shutterstock - Get 15% off with code: PIKWIZARD15Analysis finance grow graph and market  investment. Financial  business plan,earnings,sale and strategy. Stock market chart, exchange financial growth diagram. - Powered by Shutterstock - Get 15% off with code: PIKWIZARD15abstract Financial chart with moving up growing stock market graph in blue light color background - Powered by Shutterstock - Get 15% off with code: PIKWIZARD15Stock market or forex trading graph and candlestick chart suitable for financial investment concept. Economy trends background for - Powered by Shutterstock - Get 15% off with code: PIKWIZARD15Online trading, Investment, Strategy market plan, and Stock mark - Powered by Shutterstock - Get 15% off with code: PIKWIZARD15

Credit Photo

If you would like to credit the Photo, here are some ways you can do so

Free (free of charge)

Free for personal and commercial use.

Author: Creative Art

Similar Free Stock Images

Close-up of Pen on Cutting Mat with Grid Pattern
Premium
Stock market analysis, business, finance and investment. Finance analyst analyzing stock market trading graph, economic growth chart, planning and strategy, business investment with financial report
Data Analysis Graphics Overlay on Card Reader
Futuristic Financial Data Analysis in Green Tones
Analyzing Global Financial Markets with Data Visualization
Magic Inspiration for Writing with Sparkling Notepad and Ink Pen
Premium
Stack of money coin and magnifying glass with graph and candle stick chart. Business and financial concept. Stock market analyzing, stock information search.
Digital Financial Data Display with Graphs and Analytics
Financial Analysis: Chart with Graph, Document, and Calculator on Desk
Financial Data Display in Digital Grid Design
Abstract Overlay of Statistical Data on Urban Buildings
Premium
Concept of Modern Commercial Architecture and Financial Stock Market Securities Trends
Digital Financial Data Analysis with Stock Market Insights
Man Writing Notes with Overlay of Data Graphics
Digital Finance Interface with Data Visualization on Blue Background
Digital Data Processing with Neon Frame Highlighting Trends
Premium
Stock market analysis, business, finance and investment. Finance analyst analyzing stock market trading graph, economic growth chart, planning and strategy, business investment with financial report.
Digital Composite Trading Data and Growth Analytics
Digital Progress Interface on Work Desk Setup
Holographic Financial Data Visualization with Stock Trends
Financial Analysis with Overlapping Digital Communication
Premium
Stock market exchange loss trading graph analysis investment indicator business graph charts of financial board display candlestick crisis stock crash red price chart fall money
Analyzing Business Growth with Architectural Backdrop
Holographic Financial Stock Market Analysis Visualization
Business Analytics Concept with Diary, Pen, and Glasses
Financial Data Analytics with Graphs and statistics
Premium
Trading investment charts. investment finance concept.
Businessman Analyzing Data with Pen and Paper Amid Financial Graphics
Global Financial Data Processing with Graphs and Charts on Dark Background
Dynamic Financial Graph Displaying Market Trends
Funny To Do List with Pen on Notebook
Organizing Tasks with Calendar and To-Do List
Dynamic Stock Market Indicators and Graphs on Blue Background
Premium
Businessman using laptop computer analyzing sales data and financial growth graph chart report. Business planning, strategy and development. Financial accounting. market research, data analysis
Digital Data and Arrows Showcasing Market Trends
Digital Interface with Data Graphs and Charts
Digital Data Transfer with Encrypted Processing Banner
Financial Data Processing with Digital Interface
Premium
Stock market graph trading analysis investment financial, stock exchange financial or forex graph stock market graph chart business crisis crash loss and grow up gain and profits win up trend.
Calculator and Pen on Financial Document Close-Up
Businessman Analyzing Financial Data with Digital Technology
Health Checklist with Diabetes Marked in Red Pen Focus
Data Processing Visualization with Code and Graphs
Premium
Investors analyze the data stock market index via smartphone screen to trade the stock chart for planning investments take profit, trade stock exchange market and cryptocurrency data, financial.
Moving Mathematical Formulas on Graph Paper Background
Digital Financial Data Display Tracking Market Trends
Digital Financial Data Interface with Graphs and Trends
Graphical Display of Stock Market Trends with Gradient Background
Premium
Stock market chart displayed rapid growth in economy, driven by technology investments, financial data highlighted key trends in business and finance. stock, market, graph, chart, finance, business.
Futuristic Keyboard Analytics Display with Digital Graphs and Numbers
Charts and Calculator Overlapping Financial Documents Concept
Financial Data and Graphs with Futuristic Interface
Data Analytics with Dynamic Global Market Trends on Screen
Premium
Business people analyze financial data chart trading forex, investing in stock markets, funds and digital assets, Business finance technology and investment concept, Business finance background.
Graph and Chart Display on White Grid Background
Statistical Data Overlay with Pen and Diary Background
Digital Display of Financial Data with Graph and Figures
Digital Financial Data Analysis on Futuristic Blue Interface
Premium
Real estate, development and investing concept with financial chart indicators and stock market graphs on city skyscrapers tops bottom view, double exposure
Futuristic Digital Interface with Charts and Data Visualization
Futuristic Stock Market Graphs on Digital Display
Child Engaged in Writing at School Desk with Beaded Bracelets
Financial Data Visualization on Graph with Glowing Indicator
Financial Data Analysis with Charts and Calculator on Desk
Abstract Financial Data and Credit Card Machine Concept
Premium
Stock market or forex trading graph in futuristic concept suitable for financial investment or Economic trends business idea and all art work design. Abstract finance background
Sparkling Notepad with Pen for Creative Writing Inspiration
Financial Visualization Overlooking Urban Cityscape
Digital Data Analysis with Futuristic Charts
Digital Ruble Symbol with Data Graph Overlay
Premium
Stock market graph trading analysis investment financial, stock exchange financial or forex graph stock market graph chart business crisis crash loss and grow up gain and profits win up trend
Digital Interface With Cityscape And Financial Data Charts
Close-Up of African American Hand Planning in Calendar
Diverse Co-Workers Analyzing Financial Data on Laptop in Modern Office
Digital Financial Data Analysis with Infographics and Charts
Premium
Businessman holding magnifier glass with stock market graph chart for focus and analysis stock market price , trader use technology invest and value investment concept.
Neon Frame Hovering Over Digital Data Display
Dynamic Statistical Data Over Grid Network Isolated on White
Financial Planning Desk with Stock Market Data Overlay
Infographic Interface and Business Desk Elements Mixed
Premium
Stock market graph trading analysis investment financial In red, stock exchange financial or forex graph stock market graph chart business crisis crash loss and grow up gain and profits win up trend.
Digital Security and Financial Data Trends
Futuristic Data Recovery Concept on Digital Interface
Digital Finance Analytics in Modern Business Environment
Abstract Digital Stock Market Analysis with Graphs
Premium
Businessman using pen touch candle chart financial growth of business and world economy. Stock market price increase. Stock market investment analysis, financial risk management and investment.
Abstract Financial Data Visualization with Graphs and Grid Background
Financial Data Visualization with Global Network Elements
Digital Data Processing with Technology Interface on Blue Background
Dynamic Financial Data Analysis with Growth Indicators
Premium
Miniature figure standing with USD banknote and stock market graph chart for United States of America have economic recession crisis concept
Digital Visualization of Global Networking with Statistical Graphs
Elegant Workspace with Strewn Pen, Notebook and Glasses
Financial Data and Graphs on Digital Screen
Calculator and Pen on Work Desk with Digital Numbers Overlay
Global Financial Data and Digital Interface with Arrows
Global Finance and Data Visualization Interface Background
Premium
Two diverse crypto traders brokers stock exchange market investors discussing trading charts research reports growth using pc computer looking at screen analyzing invest strategy, financial risks.
Oil Pumpjack Analyzing Financial Market Trends
Digital Stock Market Data and Analytics on Screen
Financial Planner's Workspace with Document and Graphs
Digital Financial Data Analysis with Graphs and Charts
Premium
Stock market graph trading analysis investment financial, stock exchange financial or forex graph stock market graph chart business crisis crash loss and grow up gain and profits win up trend
Hand Filling Out Calendar for Organized Planning
Financial Data Overlay on Urban Skyscrapers
Digital Data with Financial Graphs on Global Grid
Rising Graphs and Interactive Financial Data Analytics Background
Premium
Financial technology and investment capital gain analytics with data of digital finance, stock market trends, fintech growth, and business performance using smart financial tools.
Stock Market Trends and Data Analysis over Digital Grid
Digital Composite of Stock Market Trends and Analytics
Digital Business Infographic with Desk Elements Overlay
Digital Stock Market Analysis Interface on Notepad
Premium
Inflation and tax concept Rising inflation rates graph. Americans' Inflation Problem and global economy recession. interest rate hike with USD money, business, finance and investment background
Digital Interface with Data Analytics and Processing Visuals
Stock Market Analysis Digital Screen with Graphs and Trends
Data Analysis Visualization with Pen and Graph Overlay
Dynamic Stock Market Analysis on Digital Screen
Premium
Stock,Business finance,investment,increase sales,revenue profit,world economic growth concept.Forex financial graph chart,market report on cash currency and finance Digital economy on dark background
Futuristic Financial Data Analysis with Graphs and Charts
Futuristic Financial Data Analysis Interface Concept
Financial Data Processing with Graphs and Charts Background
Abstract Business Technology Data Presentation
Premium
stack of silver coins with trading chart in financial concepts and financial investment business stock growth
Corporate Analytics Concept with Digital Charts and Document