
- Home >
- Stock Photos >
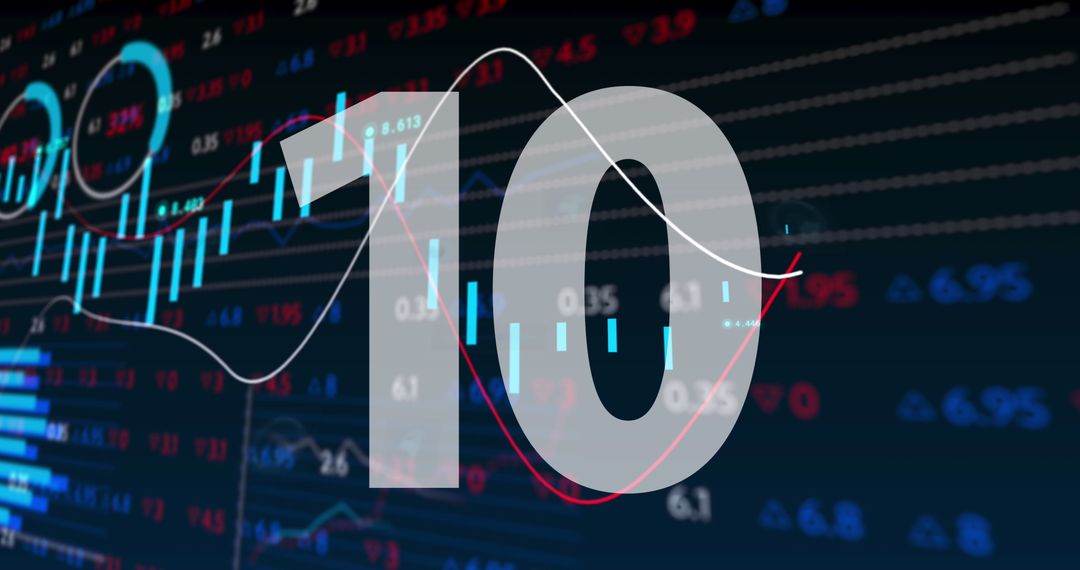
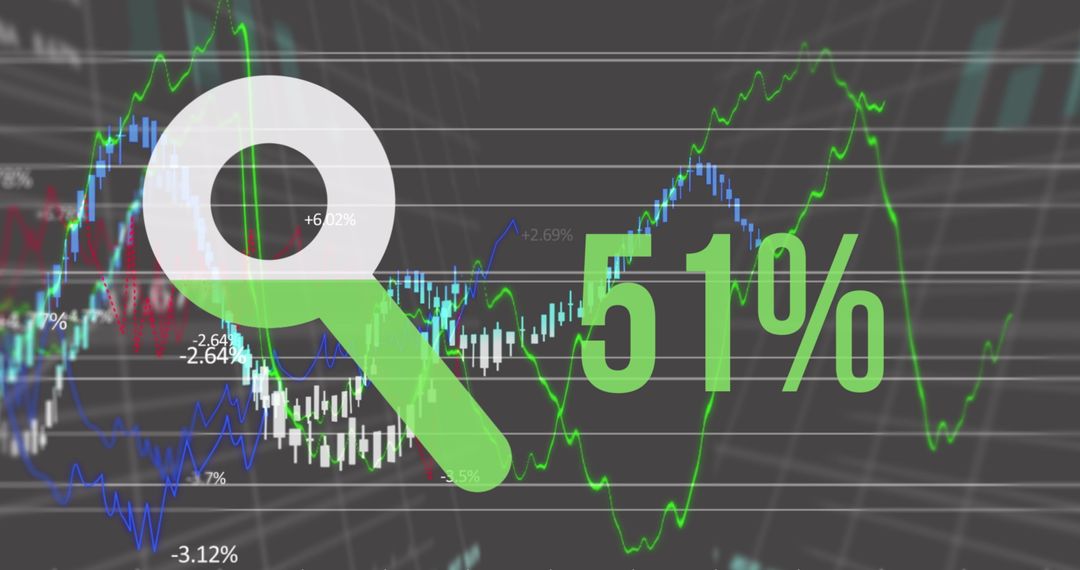
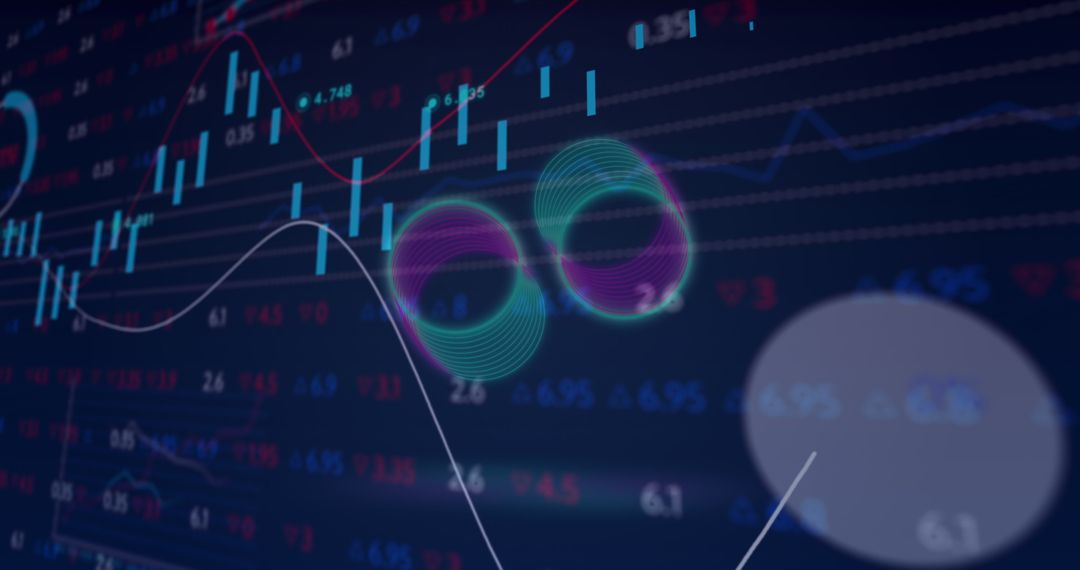
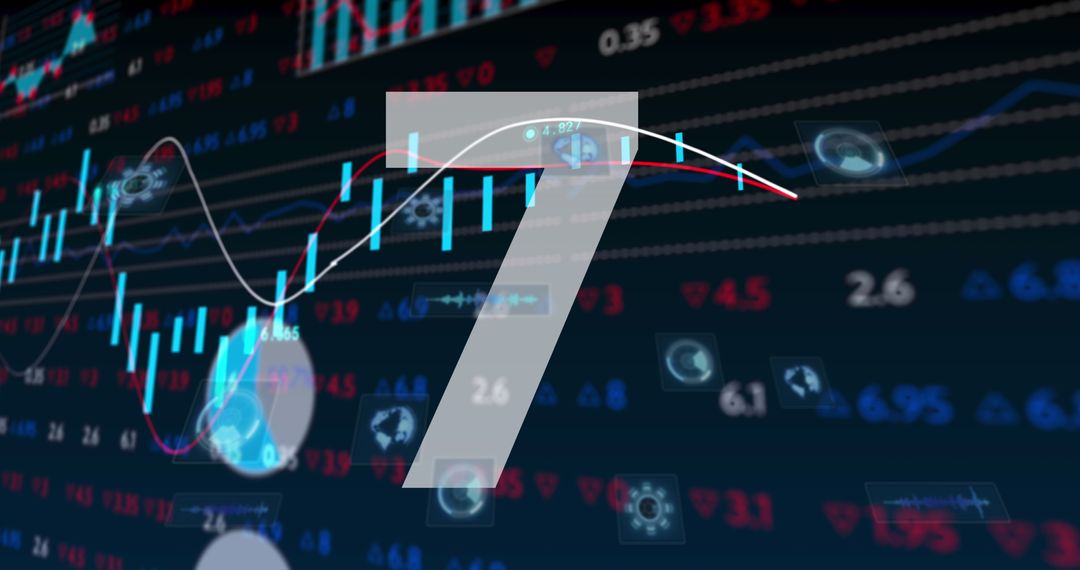
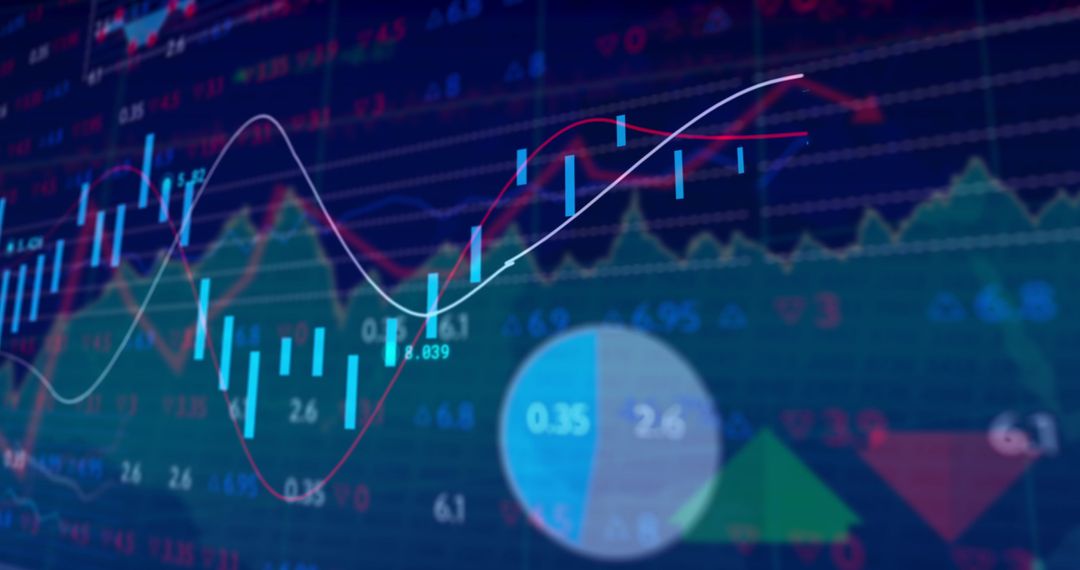
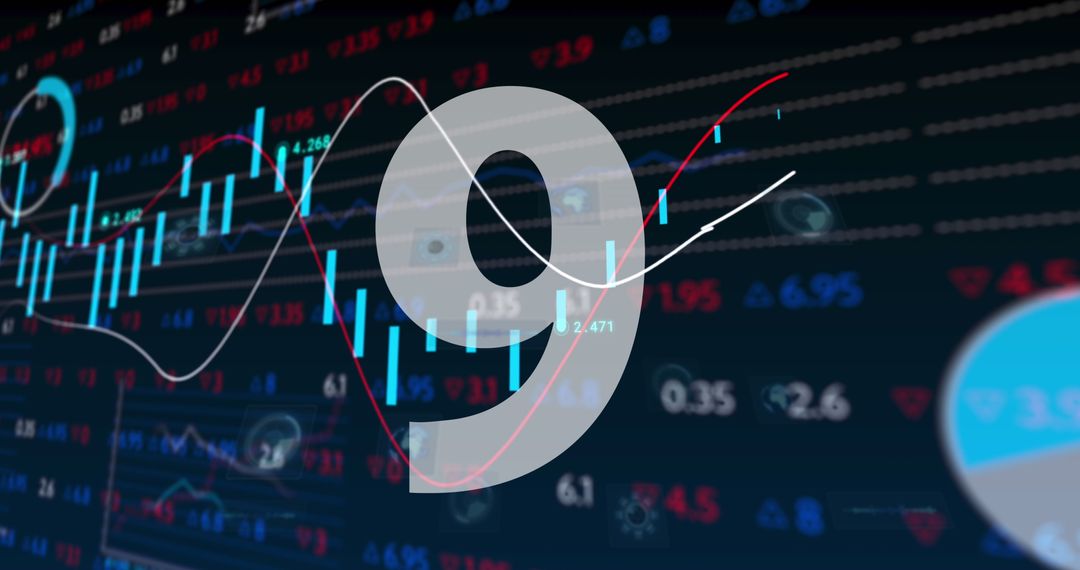
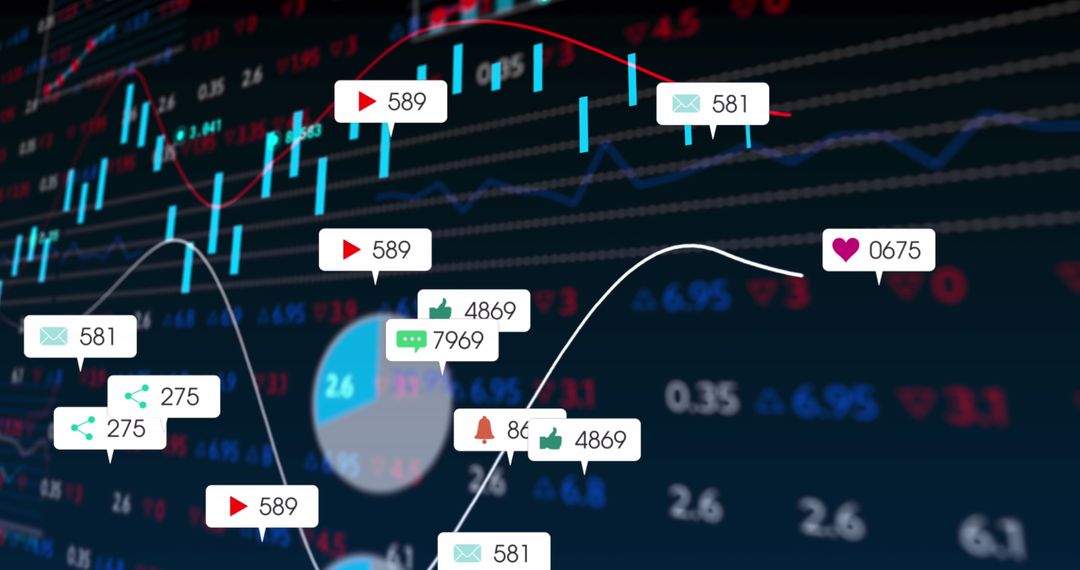
- Stock Market Countdown with Financial Graphs and Digital Data
Stock Market Countdown with Financial Graphs and Digital Data Image

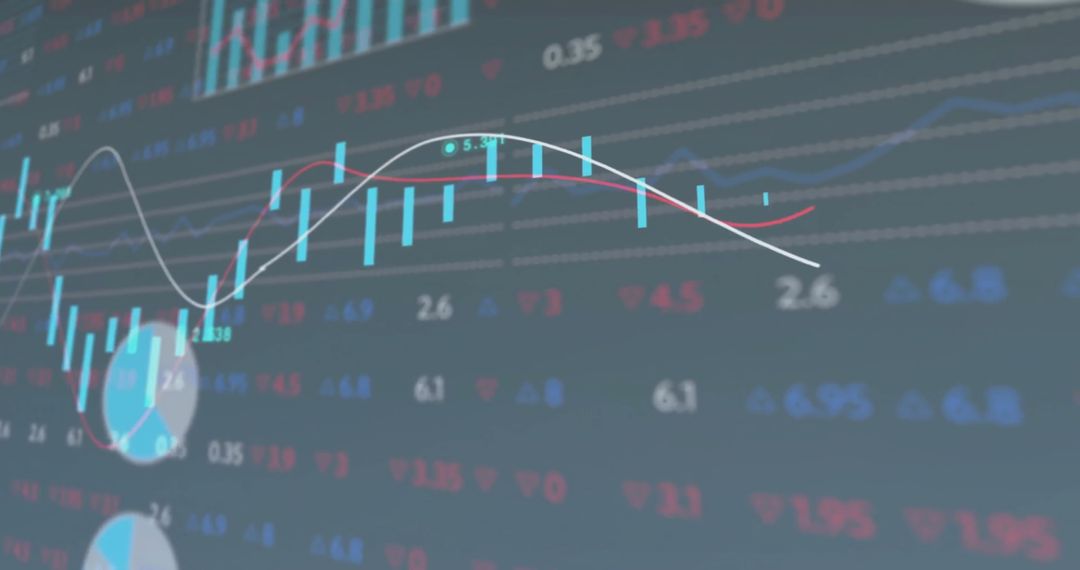
Numbers projected over a digital chart indicating a countdown amidst stock trading data, suitable for illustrating concepts in finance, digital technology, or economics presentations. Useful for backgrounds in financial reports or trading websites.
Powered by 


2
downloads
downloads
Tags:
More
Credit Photo
If you would like to credit the Photo, here are some ways you can do so
Text Link
photo Link
<span class="text-link">
<span>
<a target="_blank" href=https://pikwizard.com/photo/stock-market-countdown-with-financial-graphs-and-digital-data/c2c54bb79554d11a5cf2904f17604104/>PikWizard</a>
</span>
</span>
<span class="image-link">
<span
style="margin: 0 0 20px 0; display: inline-block; vertical-align: middle; width: 100%;"
>
<a
target="_blank"
href="https://pikwizard.com/photo/stock-market-countdown-with-financial-graphs-and-digital-data/c2c54bb79554d11a5cf2904f17604104/"
style="text-decoration: none; font-size: 10px; margin: 0;"
>
<img src="https://pikwizard.com/pw/medium/c2c54bb79554d11a5cf2904f17604104.jpg" style="margin: 0; width: 100%;" alt="" />
<p style="font-size: 12px; margin: 0;">PikWizard</p>
</a>
</span>
</span>
Free (free of charge)
Free for personal and commercial use.
Author: Authentic Images
Similar Free Stock Images

Premium


Premium


Premium


Premium


Premium


Premium


Premium


Premium


Premium


Premium


Premium


Premium


Premium


Premium


Premium


Premium


Premium


Premium


Premium


Premium


Premium


Premium


Premium


Premium

