
- Home >
- Stock Photos >
- Stock Market Data Analysis with Graphs and Metrics
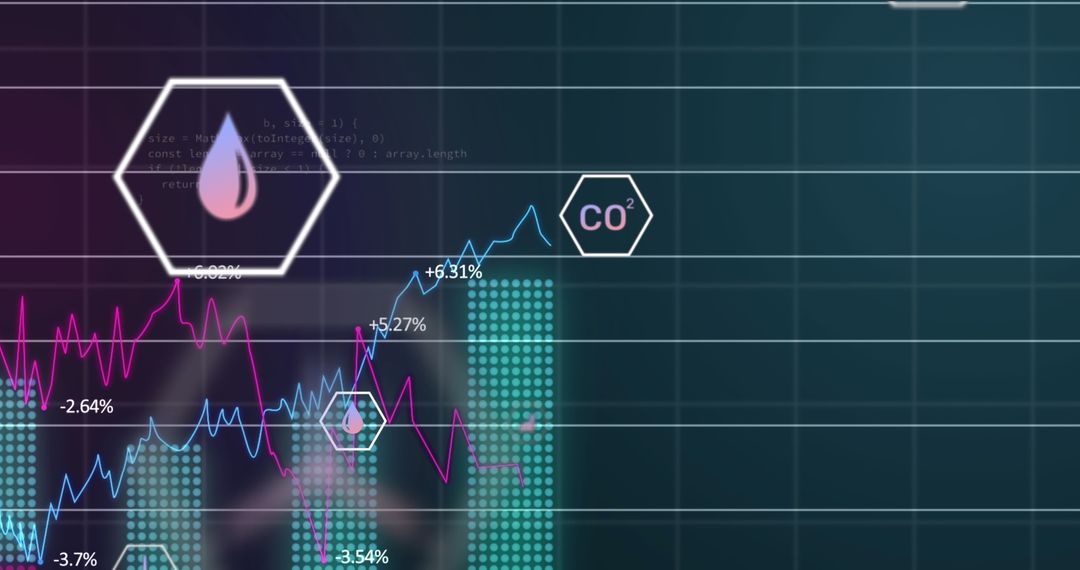
Stock Market Data Analysis with Graphs and Metrics Image

Displaying digital interface focused on stock market data with graphs and analytics. Ideal for presentations or articles related to finance, global business strategies, or data analysis in real-time trading systems.
Powered by 


2
downloads
downloads
Tags:
More
Credit Photo
If you would like to credit the Photo, here are some ways you can do so
Text Link
photo Link
<span class="text-link">
<span>
<a target="_blank" href=https://pikwizard.com/photo/stock-market-data-analysis-with-graphs-and-metrics/dfca2364a23088946d9cc16d35a5d2f3/>PikWizard</a>
</span>
</span>
<span class="image-link">
<span
style="margin: 0 0 20px 0; display: inline-block; vertical-align: middle; width: 100%;"
>
<a
target="_blank"
href="https://pikwizard.com/photo/stock-market-data-analysis-with-graphs-and-metrics/dfca2364a23088946d9cc16d35a5d2f3/"
style="text-decoration: none; font-size: 10px; margin: 0;"
>
<img src="https://pikwizard.com/pw/medium/dfca2364a23088946d9cc16d35a5d2f3.jpg" style="margin: 0; width: 100%;" alt="" />
<p style="font-size: 12px; margin: 0;">PikWizard</p>
</a>
</span>
</span>
Free (free of charge)
Free for personal and commercial use.
Author: People Creations
Similar Free Stock Images

Premium


Premium


Premium


Premium


Premium


Premium


Premium


Premium


Premium


Premium


Premium


Premium


Premium


Premium


Premium


Premium


Premium


Premium


Premium


Premium


Premium


Premium


Premium


Premium

