
- Home >
- Stock Photos >
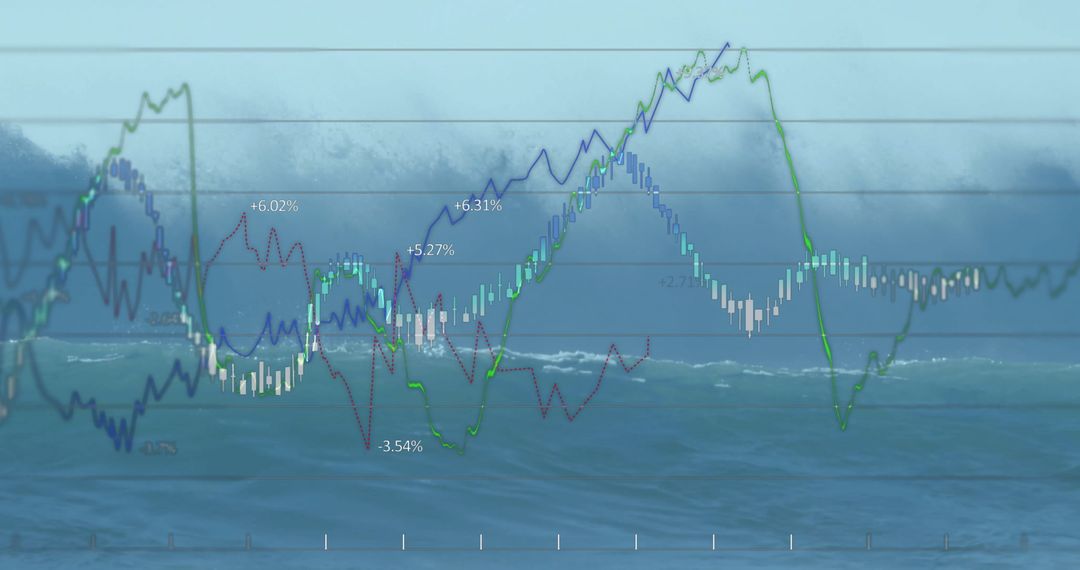
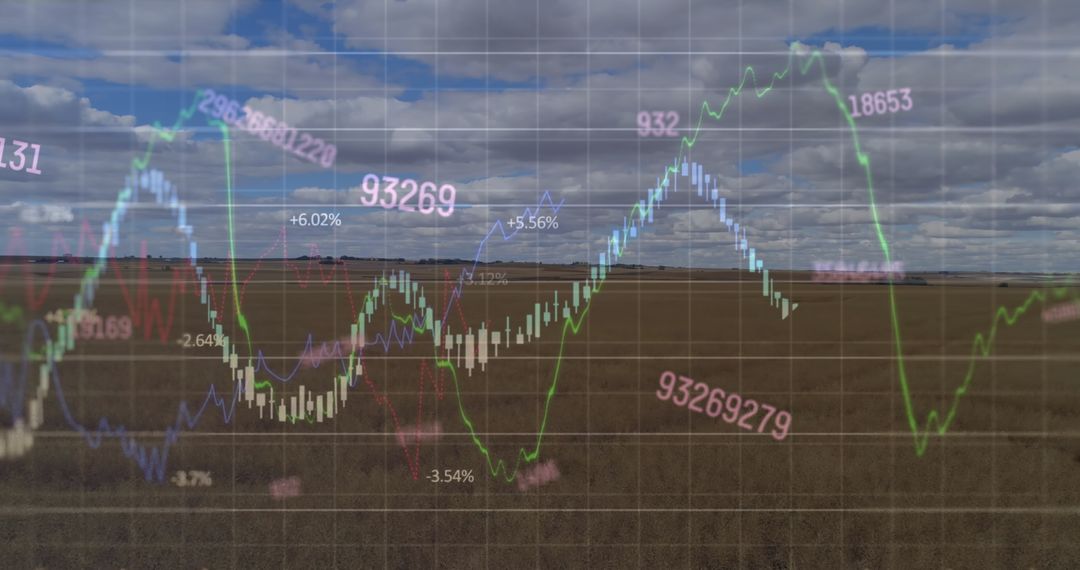
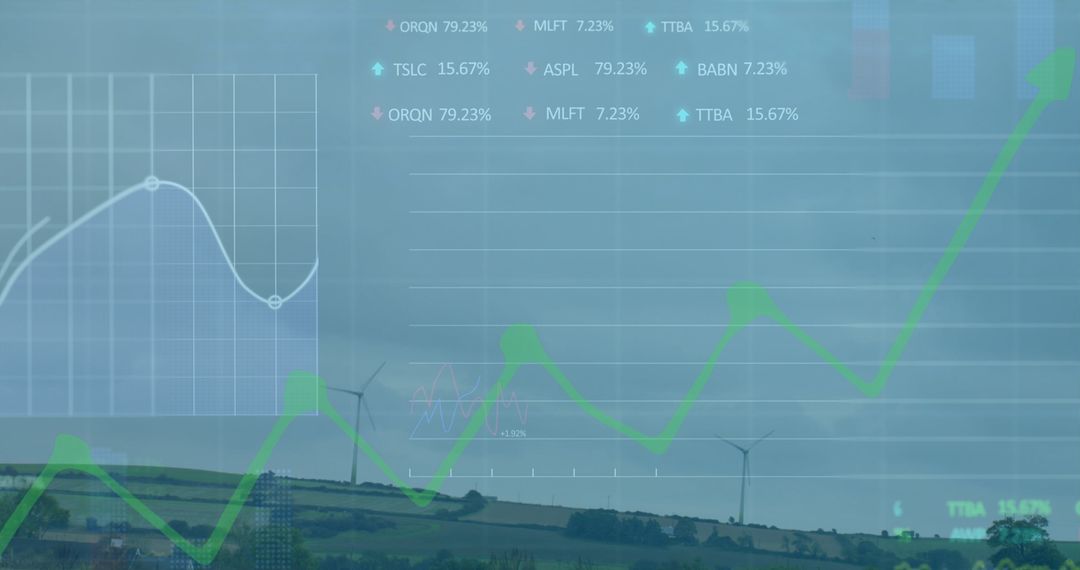
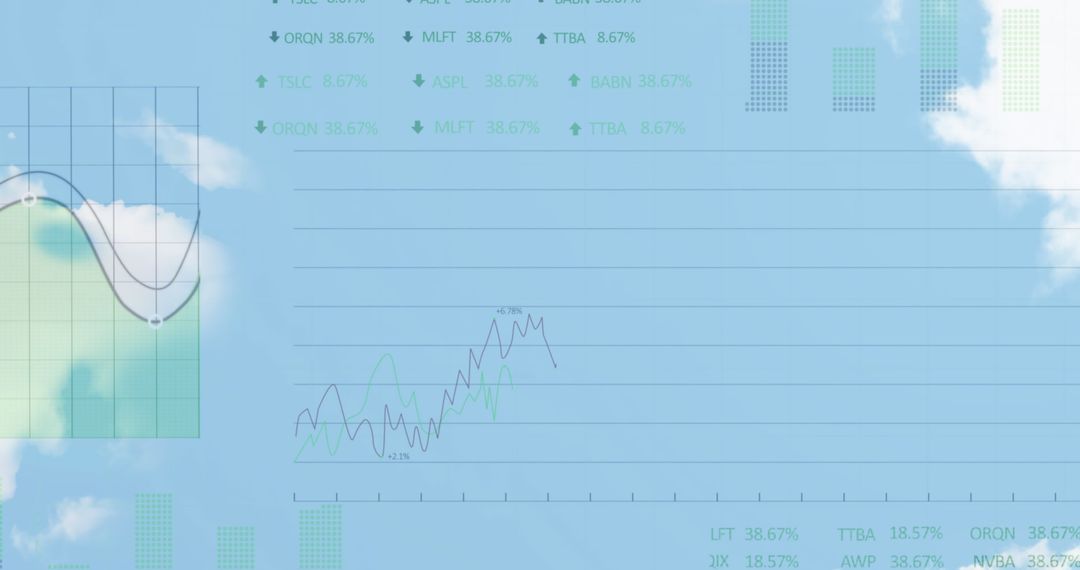
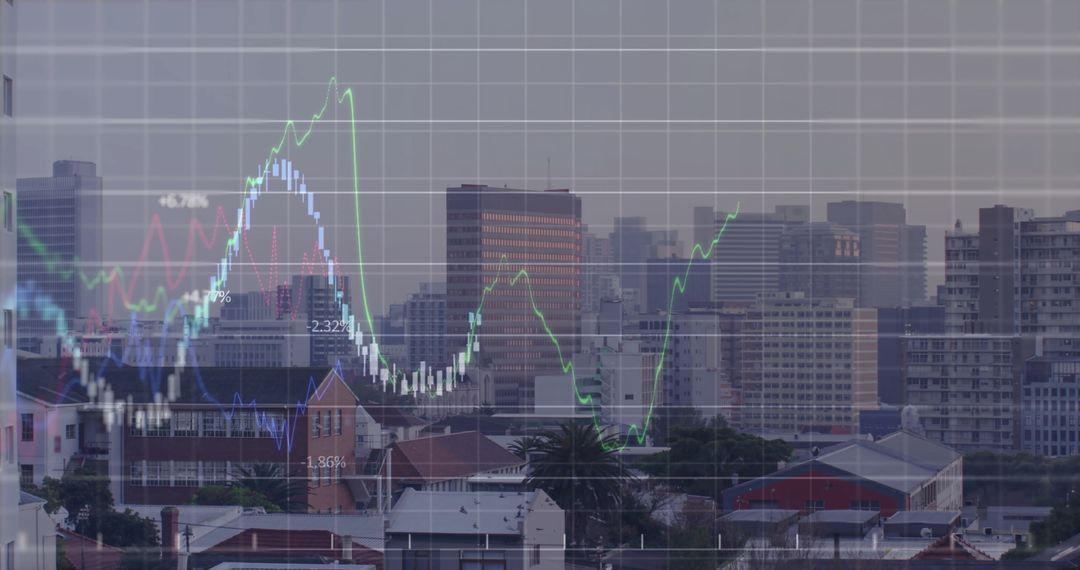
- Stock Market Data and Statistics against Cloudy Sky Background
Stock Market Data and Statistics against Cloudy Sky Background Image

Illustrates digital data processing and stock market statistics with a cloudy sky overlay, symbolizing ever-changing market trends. Useful for financial reports, economic websites or corporate presentations tailored to a tech-savvy audience seeking dynamic visuals of business concepts.
Powered by 


2
downloads
downloads
Tags:
More
Credit Photo
If you would like to credit the Photo, here are some ways you can do so
Text Link
photo Link
<span class="text-link">
<span>
<a target="_blank" href=https://pikwizard.com/photo/stock-market-data-and-statistics-against-cloudy-sky-background/cf7f805364876efee04da6f4ed04bd8d/>PikWizard</a>
</span>
</span>
<span class="image-link">
<span
style="margin: 0 0 20px 0; display: inline-block; vertical-align: middle; width: 100%;"
>
<a
target="_blank"
href="https://pikwizard.com/photo/stock-market-data-and-statistics-against-cloudy-sky-background/cf7f805364876efee04da6f4ed04bd8d/"
style="text-decoration: none; font-size: 10px; margin: 0;"
>
<img src="https://pikwizard.com/pw/medium/cf7f805364876efee04da6f4ed04bd8d.jpg" style="margin: 0; width: 100%;" alt="" />
<p style="font-size: 12px; margin: 0;">PikWizard</p>
</a>
</span>
</span>
Free (free of charge)
Free for personal and commercial use.
Author: People Creations
Similar Free Stock Images

Premium


Premium


Premium


Premium


Premium


Premium


Premium


Premium


Premium


Premium


Premium


Premium


Premium


Premium


Premium


Premium


Premium


Premium


Premium


Premium


Premium


Premium


Premium


Premium

