1. Home > 
  2. Stock Photos > 
  3. Stock Market Data Graph Over Office Desk With Coffee Cup

Stock Market Data Graph Over Office Desk With Coffee Cup Image

Stock Market Data Graph Over Office Desk With Coffee Cup

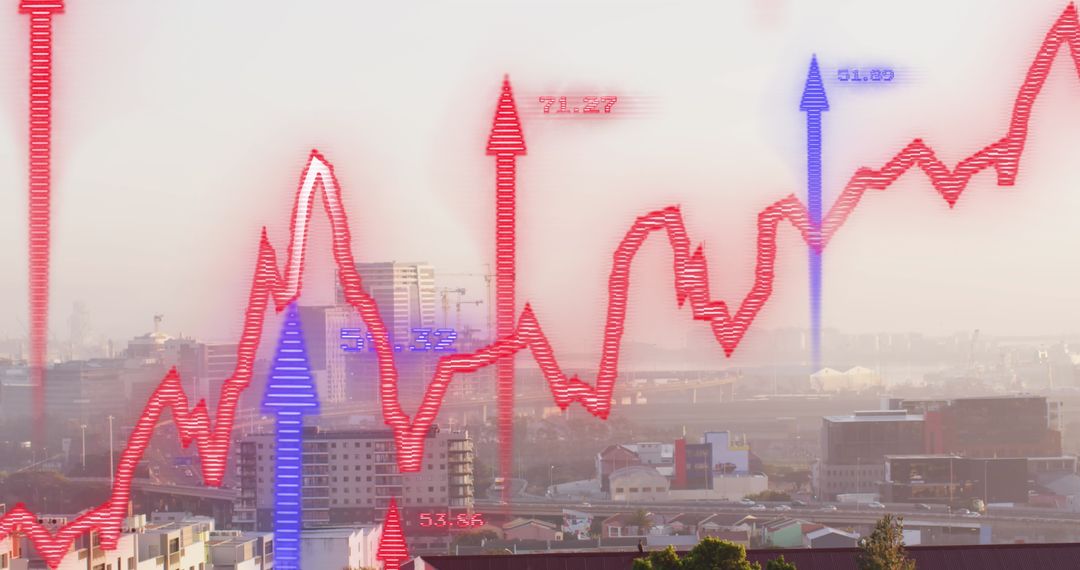
Stock market data graph overlays a workspace with coffee, notebook, laptop revealing a trader's desk environment. The upward red arrows indicate a positive trend or gain, making the scene relevant for financial analysis discussions. Useful in articles or presentations on finance, economics, trading strategies, or for illustrating investment tools.

Powered by Shutterstock logo - Get 15% off with code: PIKWIZARD15
Analysis finance grow graph and market  investment. Financial  business plan,earnings,sale and strategy. Stock market chart, exchange financial growth diagram. - Powered by Shutterstock - Get 15% off with code: PIKWIZARD15Financial advisor explaining invest stock market data consulting investor. Two busy business men analysts doing finance trading analysis pointing at exchange chart on laptop screen working in office. - Powered by Shutterstock - Get 15% off with code: PIKWIZARD15Online trading, Investment, Strategy market plan, and Stock mark - Powered by Shutterstock - Get 15% off with code: PIKWIZARD15Stock market or forex trading graph in futuristic concept suitable for financial investment or Economic trends business idea and all art work design. Abstract finance background - Powered by Shutterstock - Get 15% off with code: PIKWIZARD15Two diverse crypto traders brokers stock exchange market investors discussing trading charts research reports growth using pc computer looking at screen analyzing invest strategy, financial risks. - Powered by Shutterstock - Get 15% off with code: PIKWIZARD15

Credit Photo

If you would like to credit the Photo, here are some ways you can do so

Free (free of charge)

Free for personal and commercial use.

Author: People Creations

Similar Free Stock Images

Digital Scanning Interface with High-Tech Analysis
Premium
Real estate, development and investing concept with financial chart indicators and stock market graphs on city skyscrapers tops bottom view, double exposure
Digital Graph with Arrow and Numerical Increase Concept
Dynamic Financial Graphs Displaying Market Trends
Digital Financial Data Analysis With Declining Graph
Digital Stock Data Overlay in Modern Server Room
Premium
Businesswomen use magnifier glass find stock in stock markets, uptrends, growth economics, business strategy development, and opportunities for investment, take profit from funds, Financial Analyst.
Dynamic Financial Growth Representing Business Trends
Abstract Financial Chart Over Modern Cityscape
Green Line Rising on Digital Trading Board with Abstract Background
Dynamic Stock Market Data Amid Empty Office Setting
Premium
Investors use laptops to analyze stock market, investment strategies. and business growth analysis, investing in companies with long-term competitive advantages, against the backdrop of the city.
Digital Data Overlay on Urban Roadway Financial Concept
Digital Data Visualization with Growth Arrow and Graphs
Digital Data Trends Over High-Tech Server Room
Futuristic Digital Graph with Arrows and Data Interface
Premium
Black Businessman Holding Smartphone and Checking Stock and Cryptocurrency Market in Office. African-American Businessperson using Internet with Mobile Phone Device. Over Shoulder Shot
Digital Interface with Graphs and Data Lines in Cyber Space
Dynamic Financial Graph in Cityscape Background
Dynamic Data Display Generating Business Growth Analysis
Colleagues Analyzing Financial Data on Digital Grid Interface
Premium
Stock market or forex trading graph on touchscreen,  finance and investment concept. Economy trends for business, financial charts and digits.
Futuristic Digital Interface with Data Patterns
Futuristic Data Analysis Overlaying Cityscape Digital Interface
Digital Data and Graph Integration in City Street Scene
Financial Data Analytics with Dynamic Green Arrows
Premium
Stock market graph trading analysis investment financial, stock exchange financial or forex graph stock market graph chart business crisis crash loss and grow up gain and profits win up trend.
Digital Interface with Data Processing and Security Elements
Digital Financial Charts and Market Analysis with Data Streams on Purple
Global Finance and Data Analytics in Server Environment
Global Data Visualization With Dynamic Graphs and World Map Background
Digital Financial Data Chart with Modern City Skyscrapers
Abstract Global Finance and Data Analysis Conceptual Visual
Premium
Stock market financial investment and trading graph interface showing ticker price evolution with candlestick chart and moving average curves. Increasing profit. Forex. Person touching virtual screen.
Rising Financial Market Trends with Data Visualization
Digital Financial Data Visualization with Graph and Metrics
Abstract Financial Data Visualization in Server Room
Financial Data Visualizations Expert Economic Impact on Urban Skyline
Premium
Investors analyze graph data stock market index via digital tablet screen to trade the stock chart for planning investments take profit, trade stock exchange market and cryptocurrency data, financial.
Futuristic Data Graphing Over Urban Cityscape
Global Data Analytics on Digital Grid Interface
Diverse Female Colleagues Analyzing Market Trends on Laptop
Futuristic Stock Market Graph With Digital Overlay
Premium
Businessman analyzing forex trading graph financial data. Stock Market Investments Funds and Digital Assets. Business finance technology and investment concept. Business finance background.
Global Data Analytics and Stock Market Visual Interface
Digital Concept of Stagflation with Chart and Globe Illustration
Futuristic Digital Interface with Dynamic Financial Graph
Dynamic Data Flow with Analytics Visuals on Grid
Premium
Stock market analysis, business, finance and investment. Finance analyst analyzing stock market trading graph, economic growth chart, planning and strategy, business investment with financial report
Digital Stock Market Green Graph Against Dark Trading Board
Abstract Stock Market Data with Growing Graph
Financial Data Processing Concept Beyond Digital Interface
Dynamic Financial Stock Market Graph
Premium
Stock market chart,Stock market data on LED display concept.
Analyzing Financial Data with Business Charts Against Urban Skyline
Data Visualization on Digital Interface with Graphs and Codes
Business Colleagues Analyzing Financial Graph in Office Meeting
Futuristic Global Business Data and Interface Diagram
Premium
Stock market exchange loss trading graph analysis investment indicator business graph charts of financial board display candlestick crisis stock crash red price chart fall money
Dynamic Financial Chart on Futuristic Digital Interface
Financial Data with Molecular Background Concept
Dynamic Financial Data Displays Stock Market Trends
Falling Market Trend with Empty Classroom Background
Abstract Digital Financial Analytics with Data Visualizations
Declining Stock Market Graph on Dotted Grid Background
Premium
Stock market and business activity in Asia. Corporate value and stock movement. Stock market prices charts on tall buildings background.
Digital Representation of Inflation with Financial Data Overlay
Data Processing and Stagflation Concept with NATO Emblem
Dynamic Stock Market Data Visualization on Digital Interface Background
Digital Finance Data Overlapping Urban Skyline
Premium
Financial Expert Reviews Market Projections and Investment Strategies on Computer
Financial Growth Chart Overlay on City Skyline
Fluctuating Stock Market Graph Over Cityscape
Dynamic Stock Market Data on Digital Interface
Dynamic Global Market Trends Over World Map Visualization
Premium
Business strategy development and growing growth plan.	
Financial management strategy for business growth.Graph and chart. Investment of growth on currency rate.
Digital Interface Showing Rising Stock Market Trends
Global Stock Market Decline Concept with Graph and Digital Globe
Dynamic Digital Financial Charts Overlaid with Traditional Dashboard Elements
Dynamic Stock Market Graphs Over Digital Interface
Premium
Money business financial graph diagram of coin. Financial growth data or investment market profit bar and success report.Saving money concept.Stack of coins with trading price graph growth.
Business Women Analyzing Data in Office with Growth Chart Overlay
Financial Graphs Overlay Virtual Data Office Computers
Cybersecurity Concept with Declining Data Graph and Digital Shield
Data Analytics and Business Strategy Network Interface
Premium
Businessman analyzing forex trading graph financial data. Business finance background.business finance technology and investment concept. Stock Market Investments Funds and Digital Assets.
Green Graph Showing Forex Trends on Transparent Cyber Interface
Digital Financial Data Analysis with Globe and Laptop
Digital Financial Chart Overlay on Modern City Skyline
Graph Showing Financial Data with Colleagues Discussing Business
Premium
Businessman Drawing Upward Arrow on Digital Stock Market Graph with Trading Data, Buy and Sell Indicators, Representing Financial Growth, Investment Success Foreign currency trading and Forex Trading
Global Stock Market Analysis with Digital Interface Over World Map
Dynamic Financial Data Analysis with Graph Overlays
Dynamic Financial Market Graph Amidst Digital Equations
Dynamic Growth Chart with Rising Arrows in Green Tones
Declining Stock Market Graph on Digital Background
Dynamic Financial Stock Market Data Analysis
Premium
A vibrant financial chart displays stock market data against a city skyline at dusk, emphasizing dynamic market fluctuations
Cityscape with Financial Data Overlay and Digital Graphics
Futuristic Stock Market Data Visualization with Graphs
Data Visualization Overlay on Urban Cityscape
Financial Data Charts in Shimmering Blue Digital Space
Premium
Stockmarket online trading chart candlestick on crypto currency platform. Stock exchange financial market price candles graph data pattern analysis concept. Computer screen closeup background
Rising Digital Graph Overlay on City Skyline at Dusk
Cityscape with Stock Market Digital Interface Overlay
Digital Interface with Global Business Data Analytics
Rising Graphs Over Cityscape Illustrating Financial Growth
Premium
Financial stock market numbers and city light reflection
Rising Financial Data Highlights Global Economic Growth
Abstract Global Business Data and Cityscape Integration
Dynamic Stock Market Graph with Green Arrows and Numbers
Financial Graphs Displaying Business Trends on Grid Background
Premium
Businessman using laptop computer analyzing sales data and financial growth graph chart report. Business planning, strategy and development. Financial accounting. market research, data analysis
Financial Data Graph Overlay on Modern Office Background
Financial Growth Data Overlay on Urban Skyline
Dynamic Stock Market Visual in Modern Office Setting
Global Financial Data Interface with Uptrending Arrow
Premium
Display of Stock market quotes with city scene reflect on glass
Financial Data with Trends and Arrows Over Cityscape
Abstract Digital Interface Showing Data Analysis Concept
Cybersecurity Analysis Interface with Data Visualization
Colorful Financial Chart Representing Stock Market Trends
Premium
hand show graph chart stock market economic. growth business concept. plan strategy company increase profit to success global. trend marketing grows technology digital. economy, financial, and invest
Glowing neon stock market chart showing bullish uptrend with red arrow and data ticker