
- Home >
- Stock Photos >
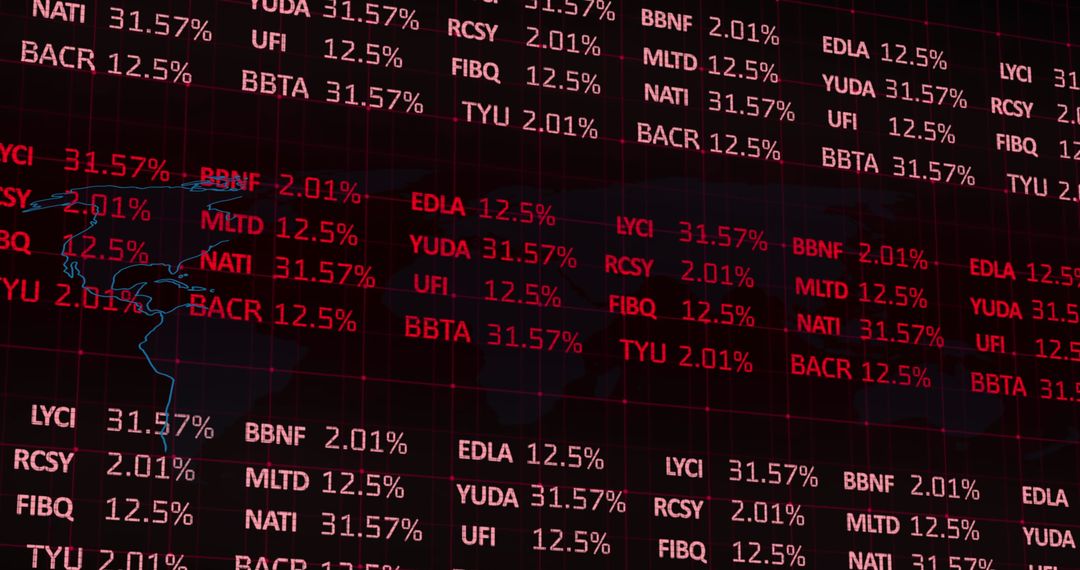
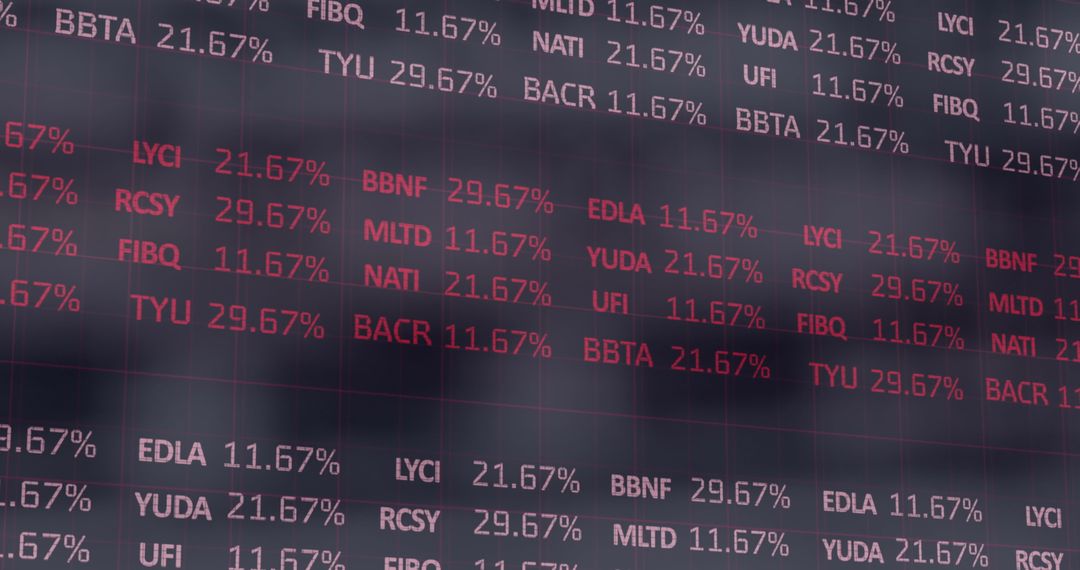
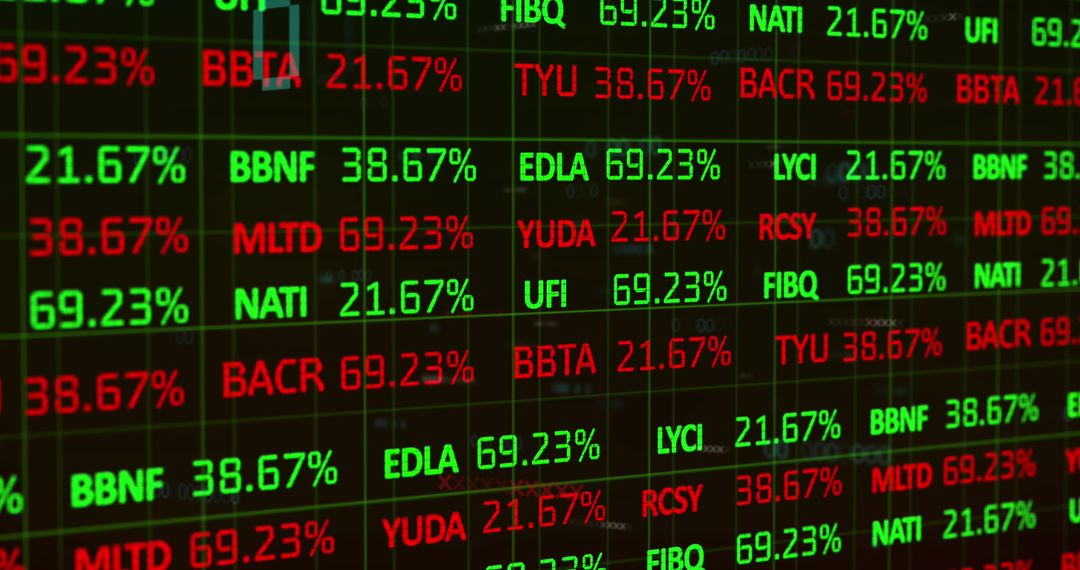
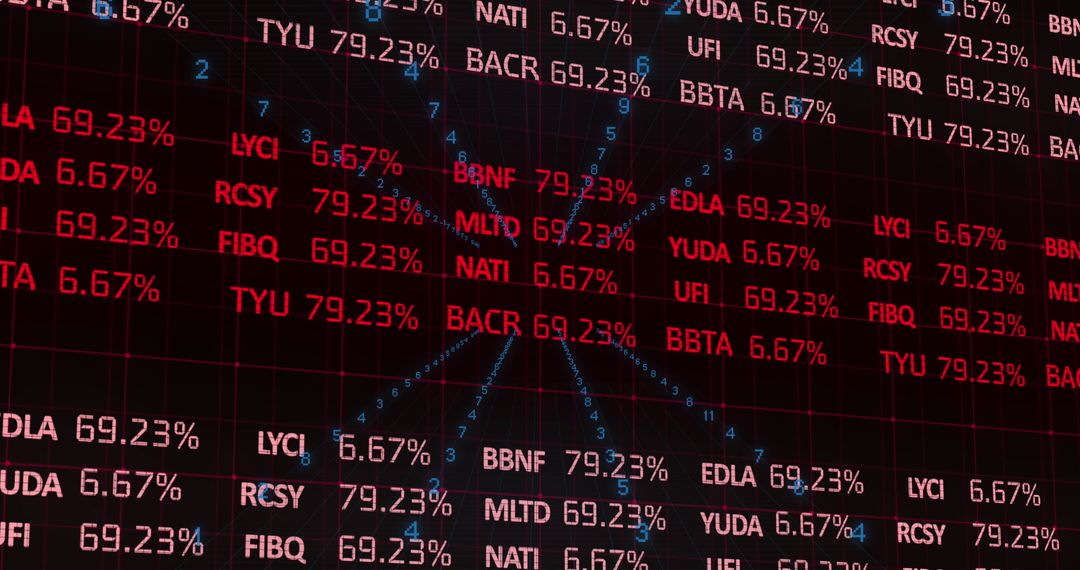
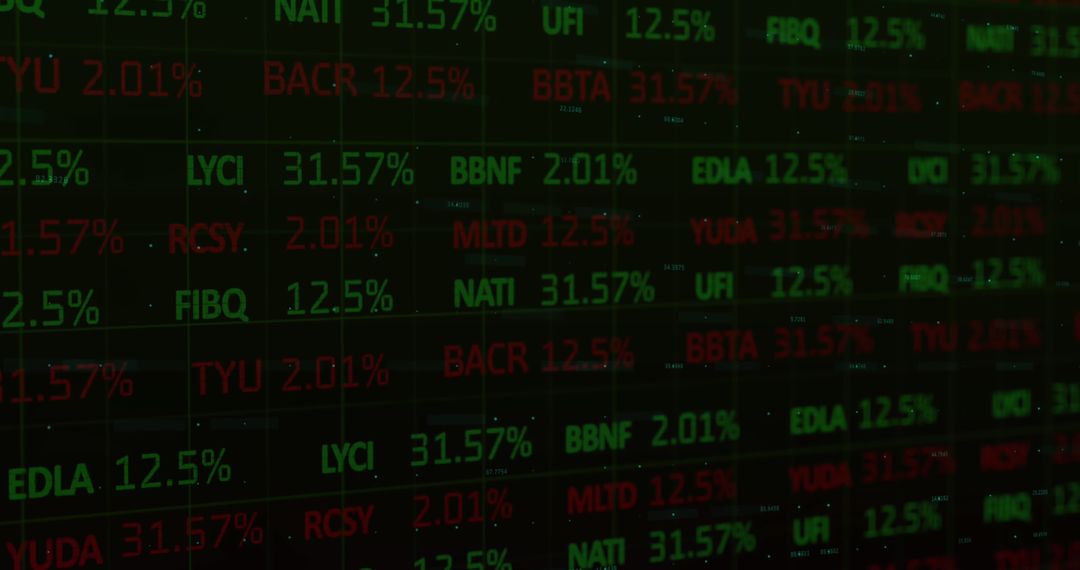
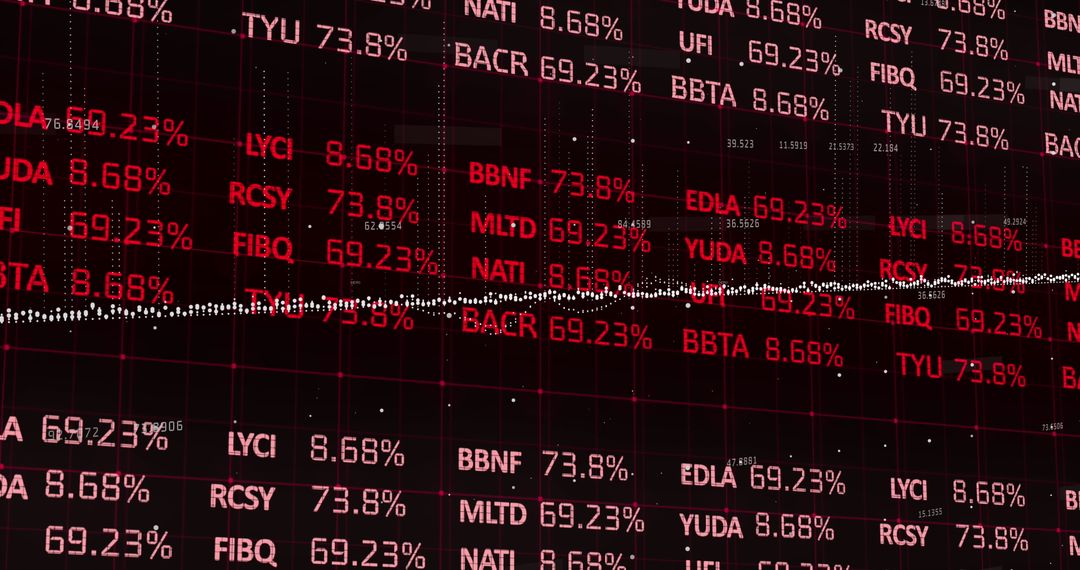
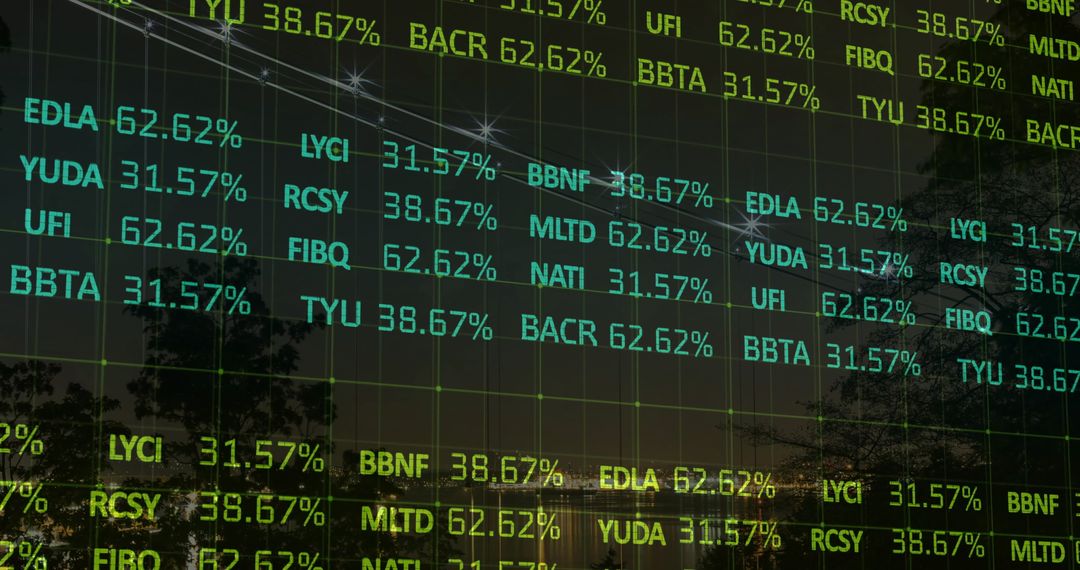
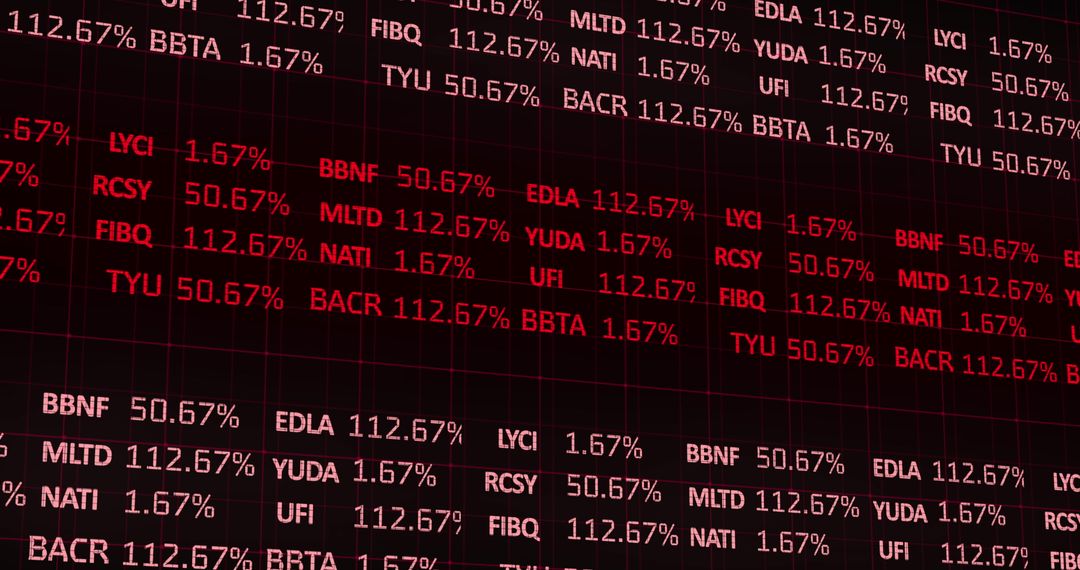
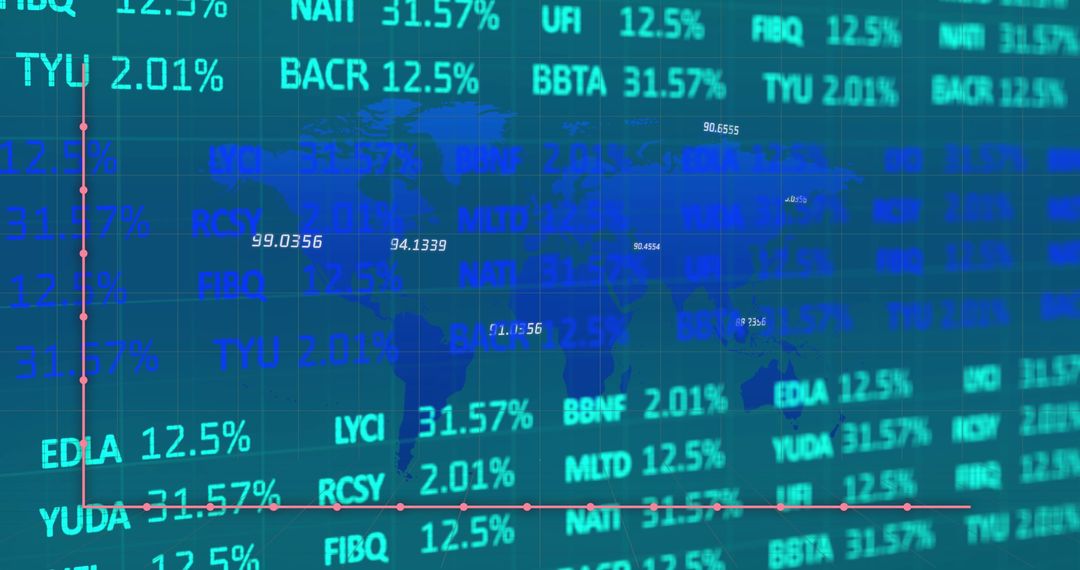
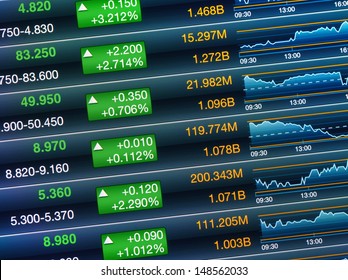
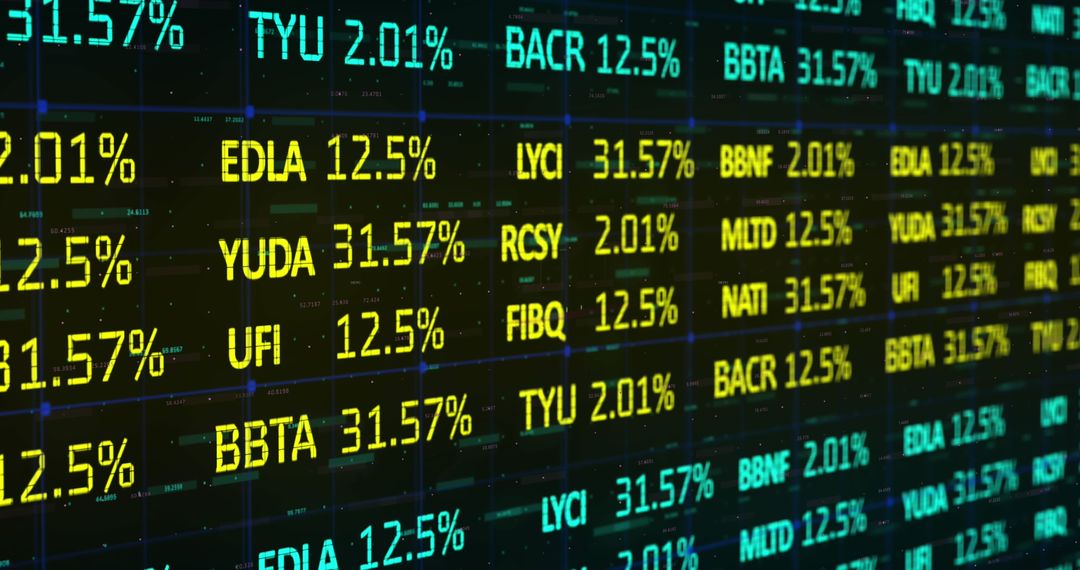
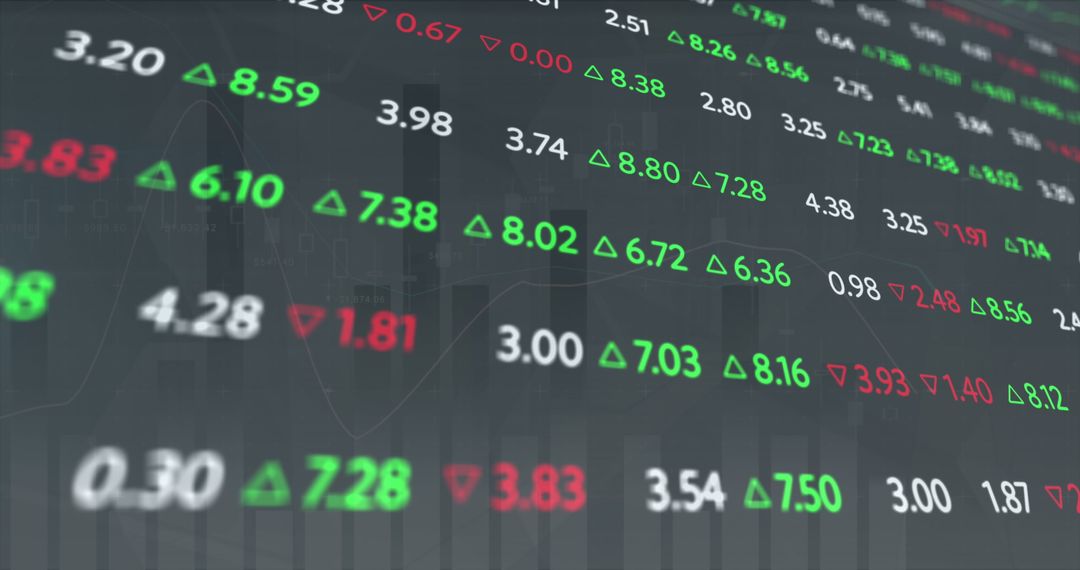
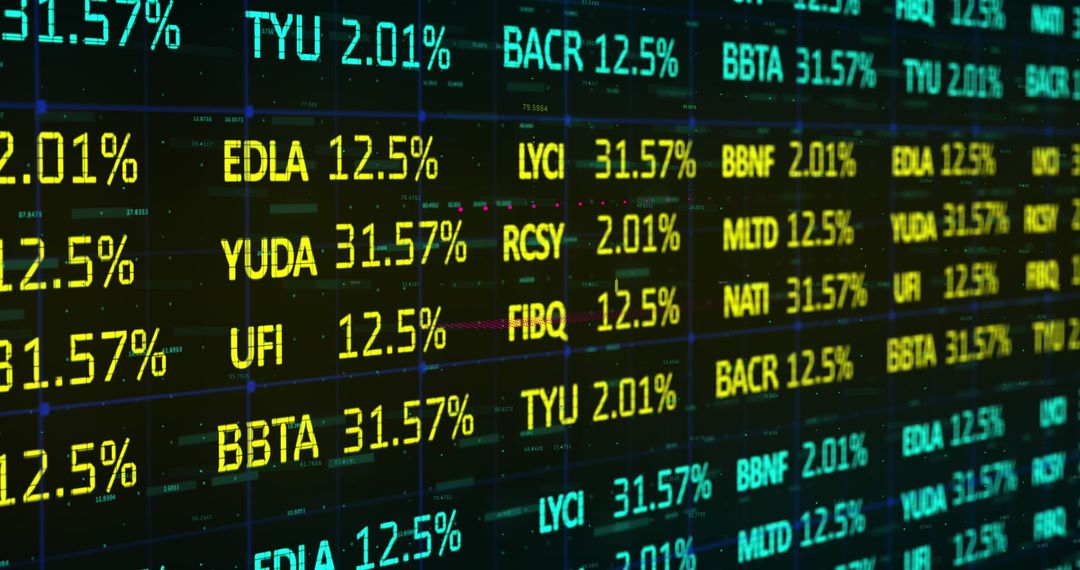
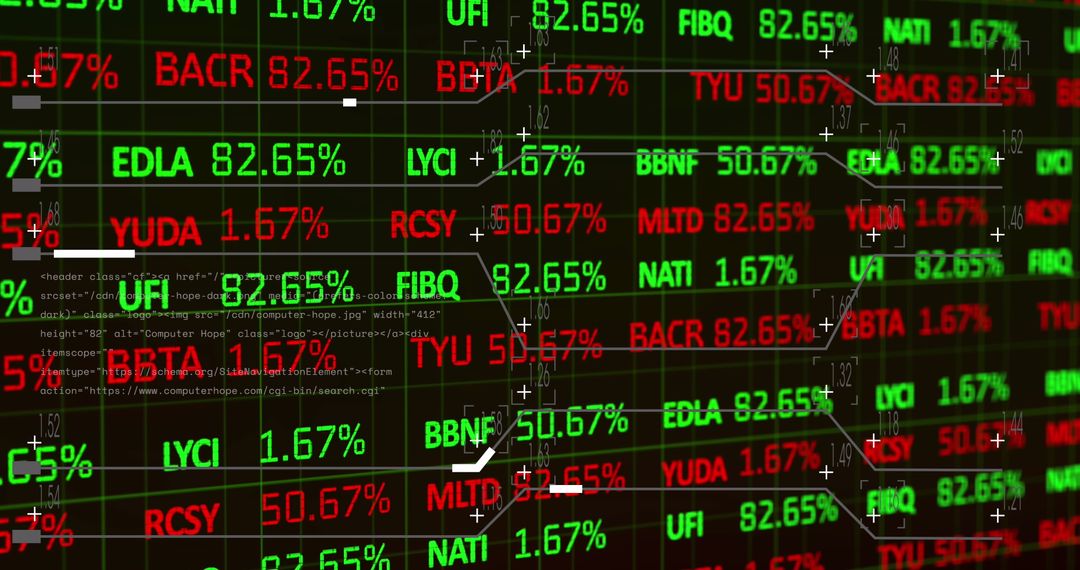
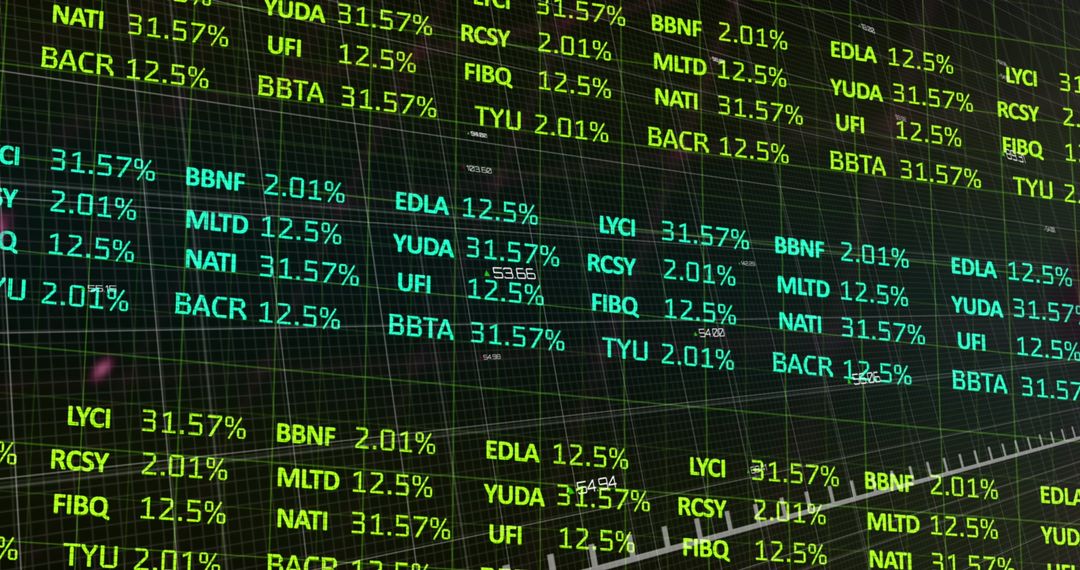
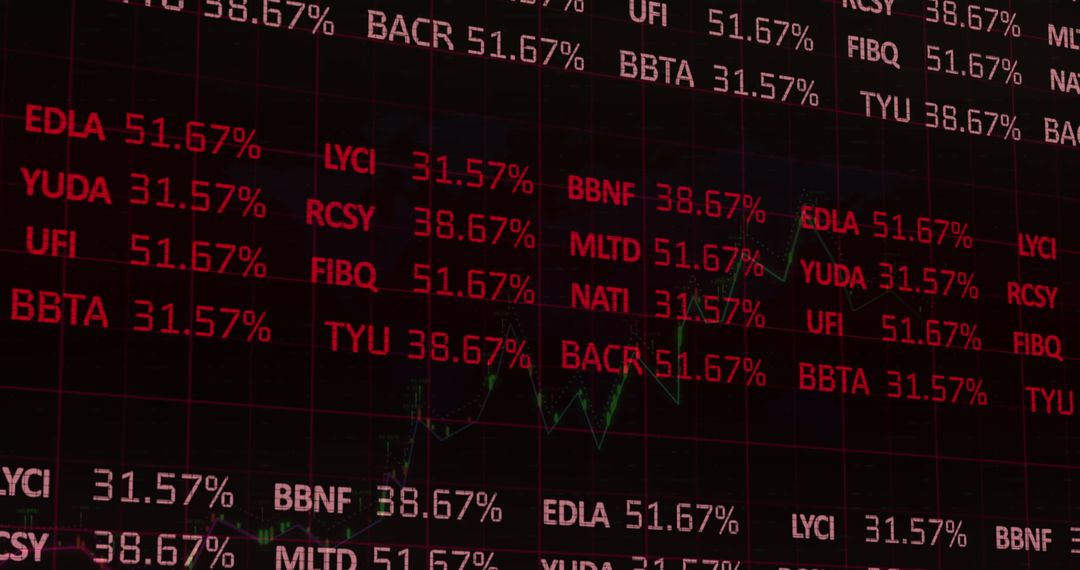
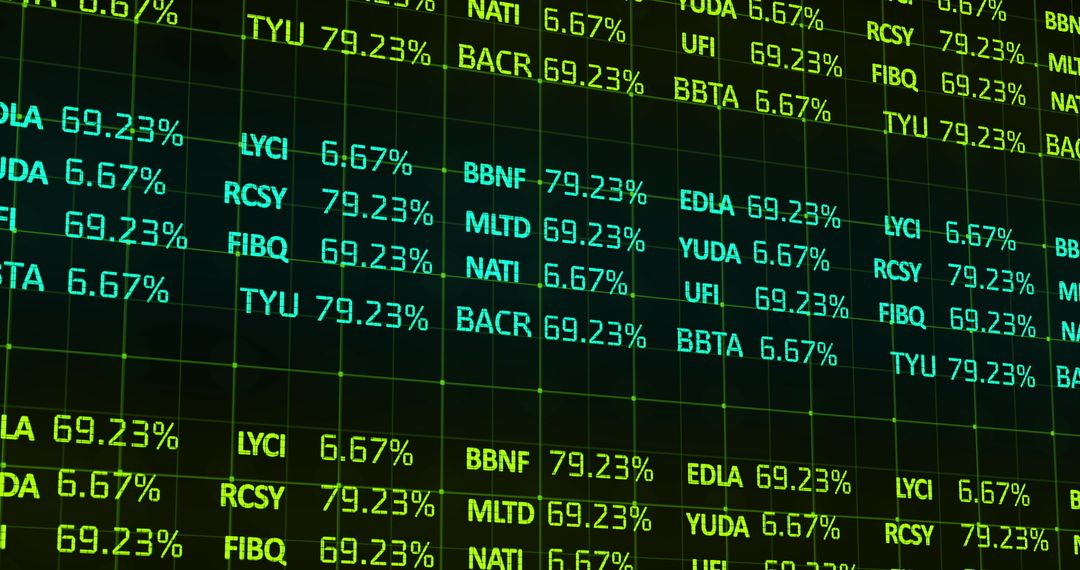
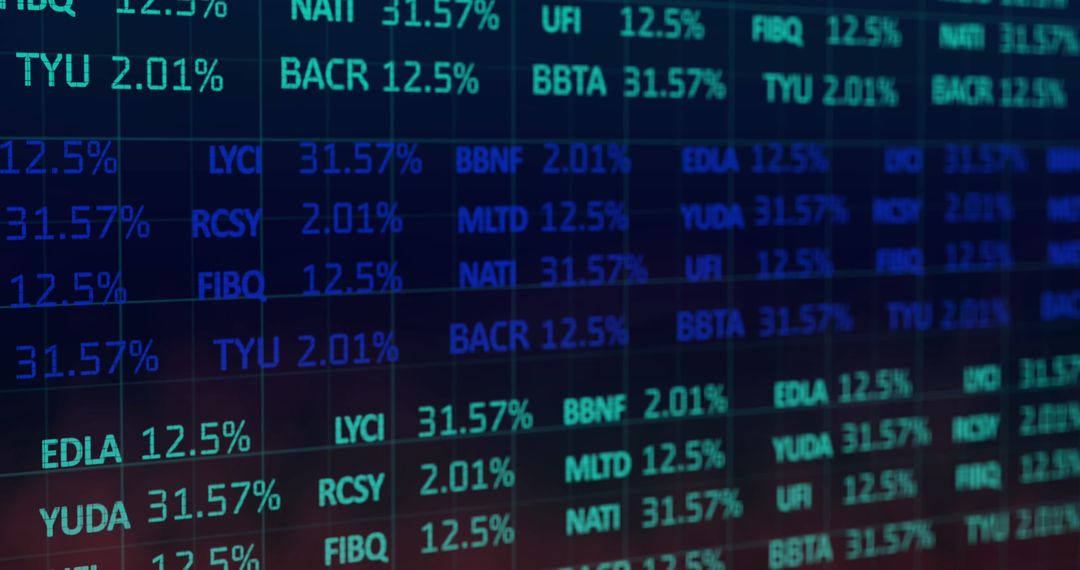
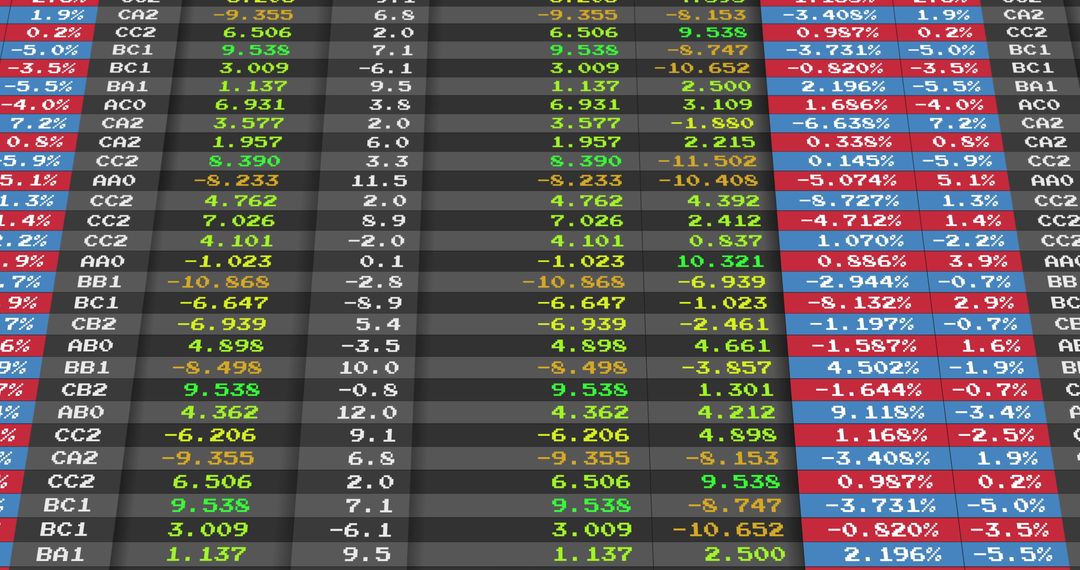
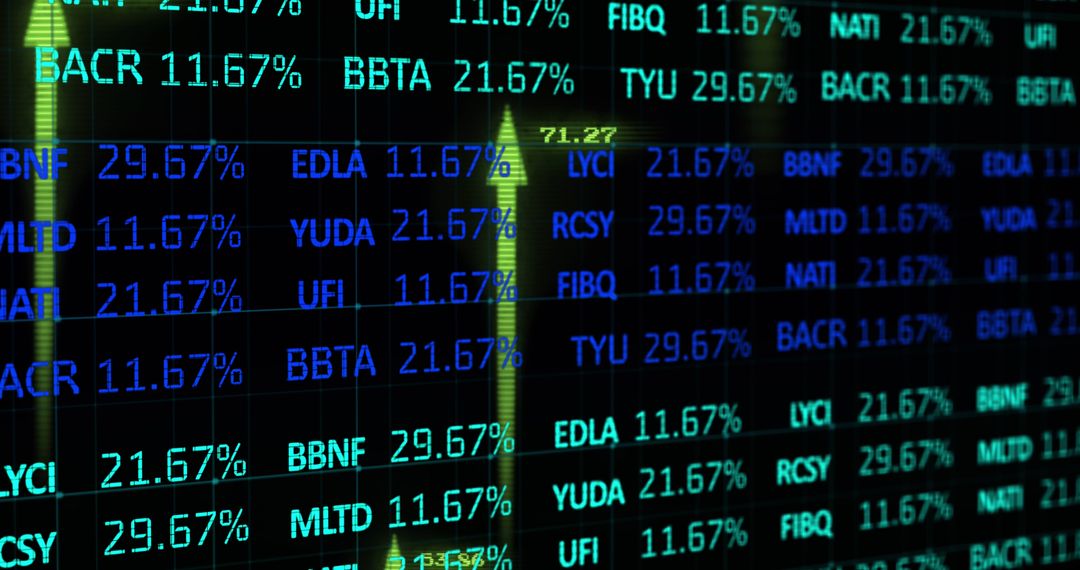
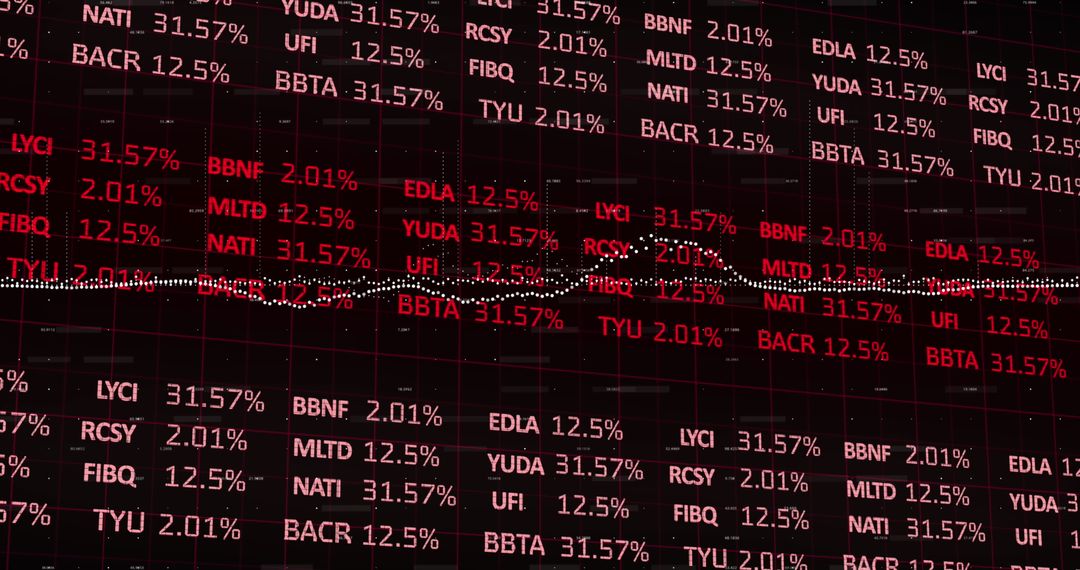
- Stock Market Data Screen Showing Fluctuating Percentages
Stock Market Data Screen Showing Fluctuating Percentages Image
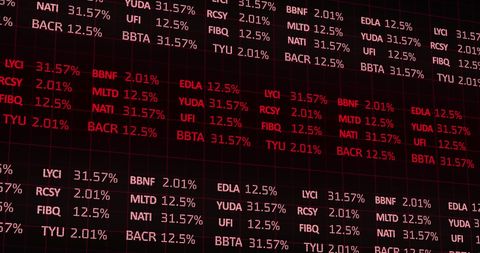
Digital display of fluctuating stock market data captures complexity of trading. Useful for illustrating financial reports, analyzing economic trends, or enhancing presentations on investment technology. Perfect visual for investment portfolios or stock market analysis content.
Powered by  - Get 15% off with code: PIKWIZARD15


2
downloads
downloads
Tags:
More
Credit Photo
If you would like to credit the Photo, here are some ways you can do so
Text Link
photo Link
<span class="text-link">
<span>
<a target="_blank" href=https://pikwizard.com/photo/stock-market-data-screen-showing-fluctuating-percentages/66f74b55c95d7f90ba90f43d553f7c90/>PikWizard</a>
</span>
</span>
<span class="image-link">
<span
style="margin: 0 0 20px 0; display: inline-block; vertical-align: middle; width: 100%;"
>
<a
target="_blank"
href="https://pikwizard.com/photo/stock-market-data-screen-showing-fluctuating-percentages/66f74b55c95d7f90ba90f43d553f7c90/"
style="text-decoration: none; font-size: 10px; margin: 0;"
>
<img src="https://pikwizard.com/pw/medium/66f74b55c95d7f90ba90f43d553f7c90.jpg" style="margin: 0; width: 100%;" alt="" />
<p style="font-size: 12px; margin: 0;">PikWizard</p>
</a>
</span>
</span>
Free (free of charge)
Free for personal and commercial use.
Author: Awesome Content
Similar Free Stock Images

Premium


Premium


Premium

Premium


Premium


Premium

Premium


Premium


Premium


Premium


Premium


Premium


Premium


Premium


Premium

Premium


Premium

Premium


Premium


Premium


Premium


Premium


Premium


Premium

