- Home >
- Stock Photos >
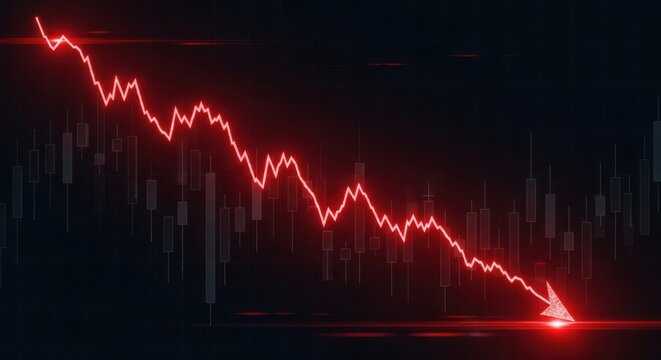
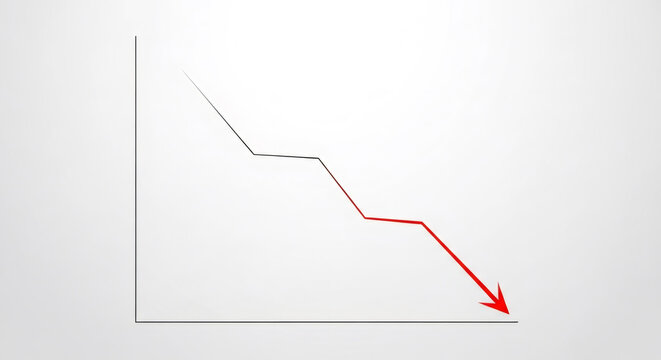
- Stock Market Decline with Red Graph Showing Slump in Financial Markets
Stock Market Decline with Red Graph Showing Slump in Financial Markets Image

Depicts stock market trends with a red line indicating a downturn. Ideal for illustrating economic decline, investment risks, trend analysis, or case studies on market fluctuations. Suitable for financial articles, economic reports, investment presentations, and educational materials on finance.
Powered by 


2
downloads
downloads
Tags:
More
Credit Photo
If you would like to credit the Photo, here are some ways you can do so
Text Link
photo Link
<span class="text-link">
<span>
<a target="_blank" href=https://pikwizard.com/photo/stock-market-decline-with-red-graph-showing-slump-in-financial-markets/a86be4db8f8155165055be95fc303007/>PikWizard</a>
</span>
</span>
<span class="image-link">
<span
style="margin: 0 0 20px 0; display: inline-block; vertical-align: middle; width: 100%;"
>
<a
target="_blank"
href="https://pikwizard.com/photo/stock-market-decline-with-red-graph-showing-slump-in-financial-markets/a86be4db8f8155165055be95fc303007/"
style="text-decoration: none; font-size: 10px; margin: 0;"
>
<img src="https://pikwizard.com/pw/medium/a86be4db8f8155165055be95fc303007.jpg" style="margin: 0; width: 100%;" alt="" />
<p style="font-size: 12px; margin: 0;">PikWizard</p>
</a>
</span>
</span>
Free (free of charge)
Free for personal and commercial use.
Author: Authentic Images
Similar Free Stock Images

Premium


Premium


Premium


Premium


Premium


Premium


Premium


Premium


Premium


Premium


Premium


Premium


Premium


Premium


Premium


Premium


Premium


Premium


Premium


Premium


Premium


Premium


Premium


Premium